Die Ticket-Deflektor-Analysen in Document360 geben Ihnen einen Überblick darüber, wie gut Ihre Ticket-Ablenkungsformulare Support-Anfragen reduzieren. Es erfasst, wie viele Anfragen durch Ihre Knowledge Base-Artikel gelöst wurden, wie viele Formulare überhaupt eingereicht wurden und welche Schlüsselbegriffe und Artikel am besten abgeschnitten haben. Sie können im Bereich Analytics ( ) im Knowledge Base Portal darauf zugreifen.
Warum Ticket-Deflektor-Analysen verwenden
- Nutzen Sie es, um zu messen, wie effektiv Ihre Wissensdatenbank Support-Tickets abwehrt, damit Sie erkennen können, wo Inhaltsverbesserungen am meisten Wirkung zeigen.
- Nutze es, um die nützlichsten und am wenigsten nützlichen Artikel in deinem Ticket-Deflektor-Flow zu finden, damit du sie aktualisieren oder erweitern kannst.
- Nutzen Sie es, um häufig ausgewählte Fragen und hochfrequente Schlüsselwörter zu identifizieren, die keine Antworten liefern und auf deutliche Inhaltslücken hinweisen.
Wie man auf Ticket-Deflektor-Analysen zugreift
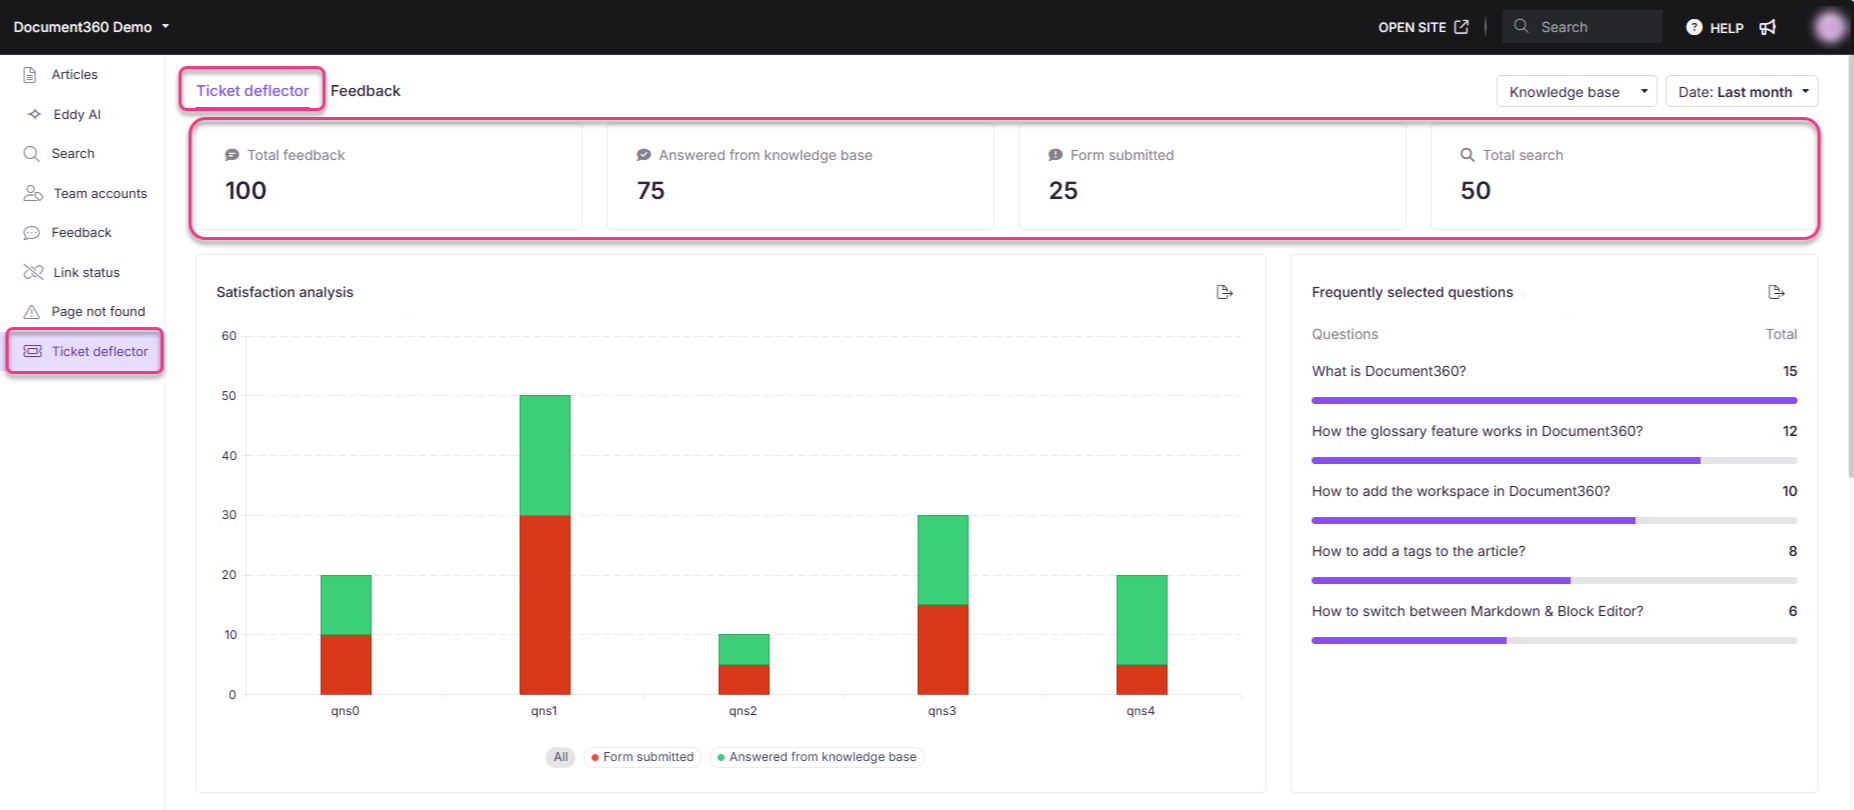
Im Knowledge Base Portal navigieren Sie in der linken Navigationsleiste zu Analytics () und klicken Sie dann im linken Navigationsbereich auf Ticket-Deflektor .

Die Seite öffnet sich im Tab Ticket-Deflektor und zeigt standardmäßig Daten der letzten 7 Tage an.
Filter anwenden
- Klicken Sie auf das Dropdown-Menü des Datumsfilters und wählen Sie einen vordefinierten Zeitraum (wie diesen Monat oder letzten Monat) oder wählen Sie benutzerdefiniert , um einen Datumsbereich anzugeben.
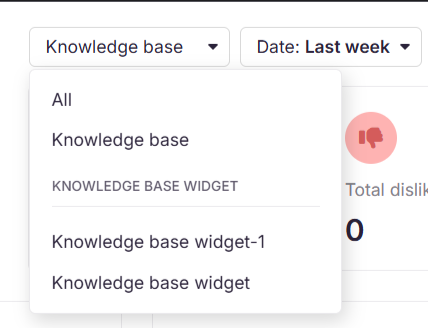
- Wenn du das Knowledge Base-Widget aktiviert hast, nutze das Dropdown-Menü oben rechts, um zwischen All, Knowledge Base und Widget-Analytics zu wechseln.
- Um JWT-authentifizierte Benutzerinteraktionen in privaten oder gemischten Projekten zu verfolgen, wählen Sie im Dropdown-Menü das JWT-Widget aus. Weitere Informationen finden Sie unter Configure JWT for knowledge base-Widget.
Ticket-Deflektor-Analysedaten können bis zu 15 Minuten benötigen, um im Knowledge Base-Portal angezeigt zu werden.
Ticket-Deflektor-Tab
Der Reiter Ticket-Deflektor ist die Standardansicht. Oben sind vier metrische Kacheln zu sehen:
| Metrik | Beschreibung |
|---|---|
| Gesamtfeedback | Gesamtzahl der Rückmeldungen, einschließlich beantworteter Anfragen aus der Wissensdatenbank und eingereichten Formulare. |
| Beantwortet aus der Wissensdatenbank | Anzahl der Anfragen, die durch Artikel in der Wissensdatenbank gelöst werden, ohne dass der Benutzer ein Ticket einreicht. |
| Formular eingereicht | Gesamtzahl der eingereichten Ticket-Deflektor-Formulare. |
| Gesamtsuche | Gesamtzahl der auf der Quick-Support-Seite der Wissensdatenbank durchgeführten Suchanzahlen. |
Unterhalb der Kacheln ist der Tab in folgende Abschnitte unterteilt:
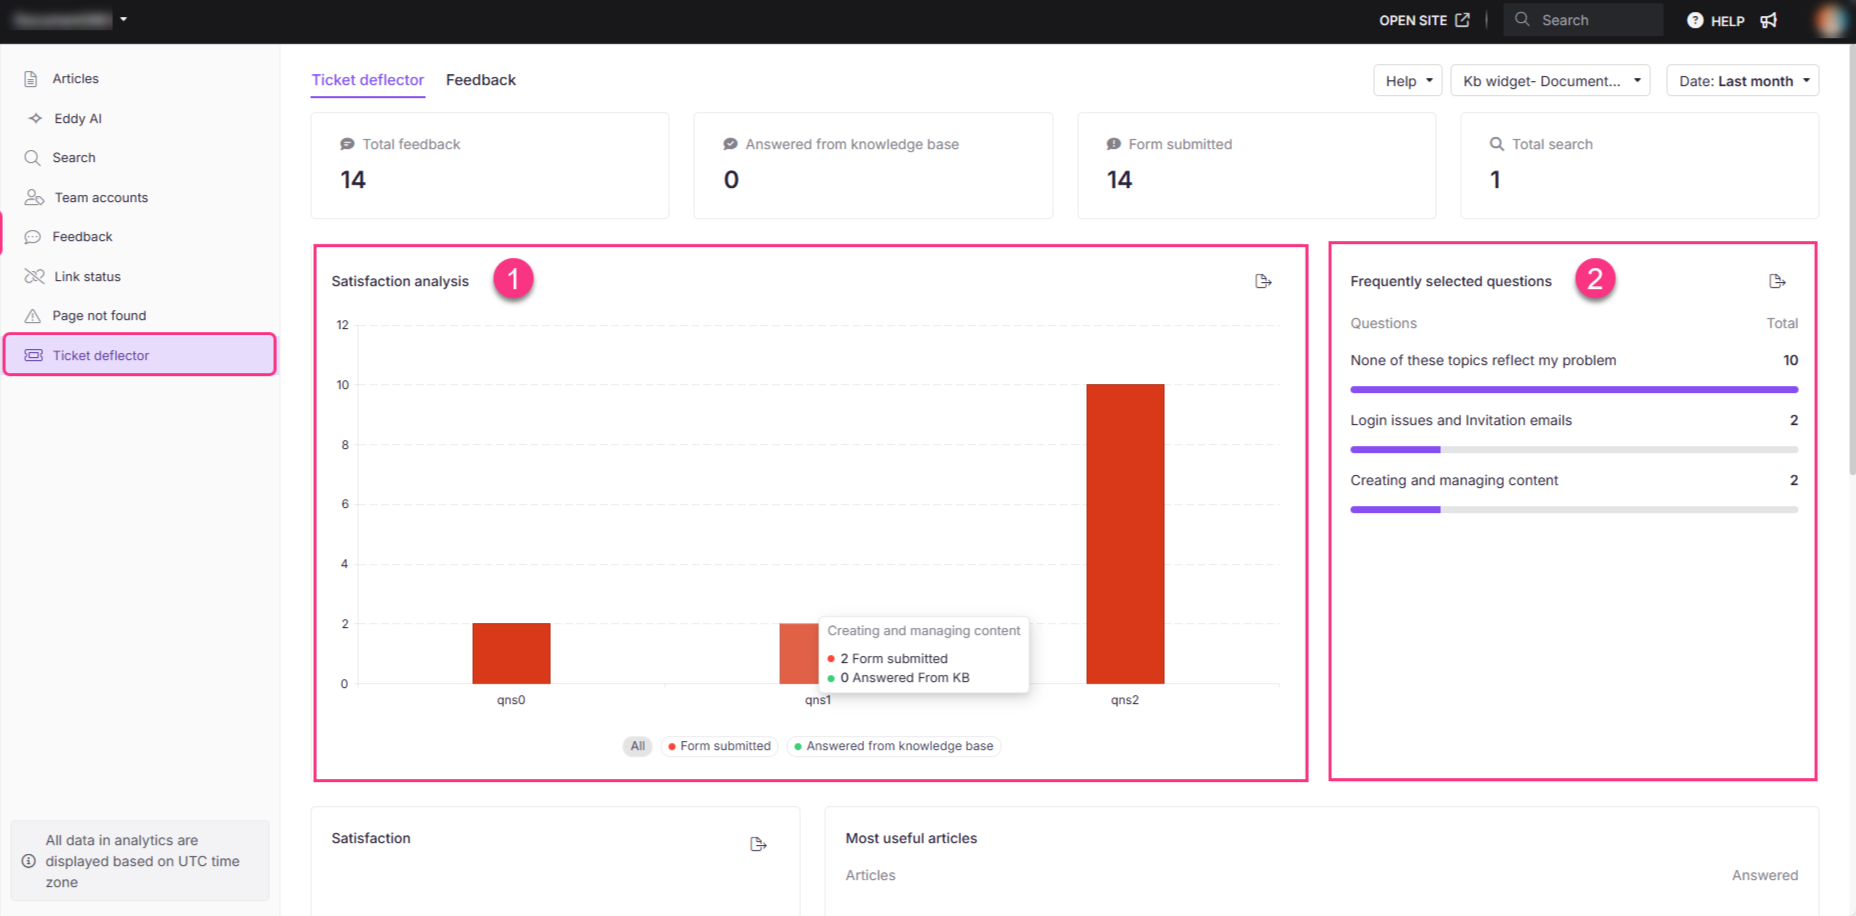
Zufriedenheitsanalyse
Dieses Liniendiagramm zeigt das Volumen der eingereichten Formulare und beantworteten Anfragen aus der Wissensdatenbank im ausgewählten Zeitraum. Klicken Sie auf die Legenden unten, um zwischen All, Formular eingereicht und Beantwortet aus den Wissensdatenbankansichten zu wechseln. Fahren Sie mit der Maus über das Diagramm, um genaue Werte für ein bestimmtes Datum zu sehen. Klicken Sie auf Bild exportieren (), um den Graphen als PNG-Datei zu speichern.
Häufig ausgewählte Fragen
Dieser Abschnitt listet die fünf häufigsten Fragen auf, die am häufigsten aus dem Ticket-Deflektor-Formular ausgewählt wurden, sowie wie oft jede einzelne ausgewählt wurde. Klicken Sie auf das Export-()-Symbol, um die Liste herunterzuladen.
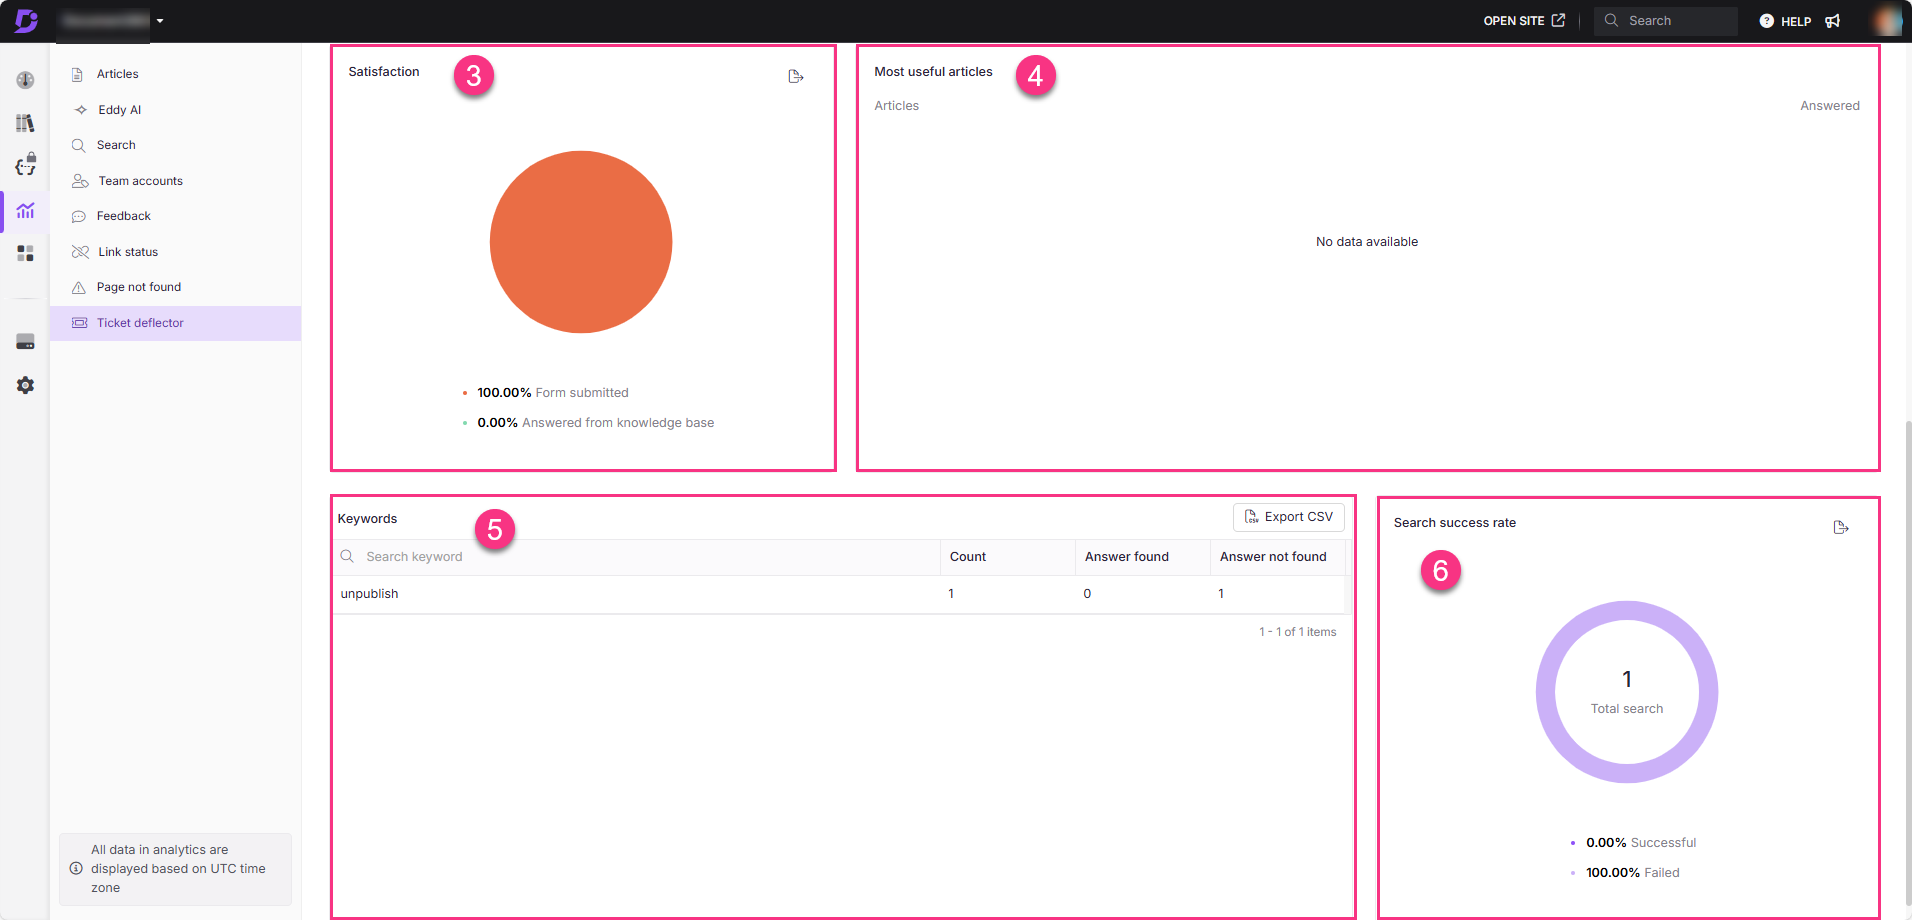
Zufriedenheit
Dieses Tortendiagramm zeigt das Verhältnis der eingereichten Formulare (orange) zu den aus der Wissensdatenbank beantworteten Anfragen (grün). Klicken Sie auf Bild exportieren (), um es als PNG-Datei zu speichern.
Nützlichste Artikel
Dieser Abschnitt listet die Top-Artikel auf, die Nutzeranfragen im Ticket-Deflektor-Flow erfolgreich gelöst haben. Für jeden Artikel wird Folgendes dargestellt:
- Artikel: Der Titel des Artikels. Fahren Sie mit der Maus darüber und klicken Sie auf View in der Wissensdatenbank (), um es auf der Website der Knowledge Base zu öffnen.
- Beantwortet: Die Anzahl der Anfragen, die der Artikel beantwortet hat.
Schlüsselwörter
Dieser Abschnitt zeigt Suchdaten auf Schlüsselwortebene aus dem Ticket-Deflektor-Formular:
| Spielfeld | Beschreibung |
|---|---|
| Schlüsselwort | Der vom Nutzer eingegebene Suchbegriff. |
| Graf | Wie oft das Schlüsselwort gesucht wurde. |
| Antwort gefunden | Ob die Durchsuchung ein relevantes Ergebnis ergab. |
| Antwort nicht gefunden | Ob die Durchsuchung kein Ergebnis ergeben hat. |
Klicken Sie auf CSV exportieren , um die Schlüsselwortliste im Format .csv herunterzuladen.
Sucherfolgsrate
Dieses Tortendiagramm zeigt den Prozentsatz der Suchanfragen, die Ergebnisse (erfolgreich) ergaben, im Vergleich zu denen, die nicht (erfolglos) für das ausgewählte Ticket-Deflektorformular geliefert wurden. Klicken Sie auf Bild exportieren (), um es als PNG-Datei zu speichern.
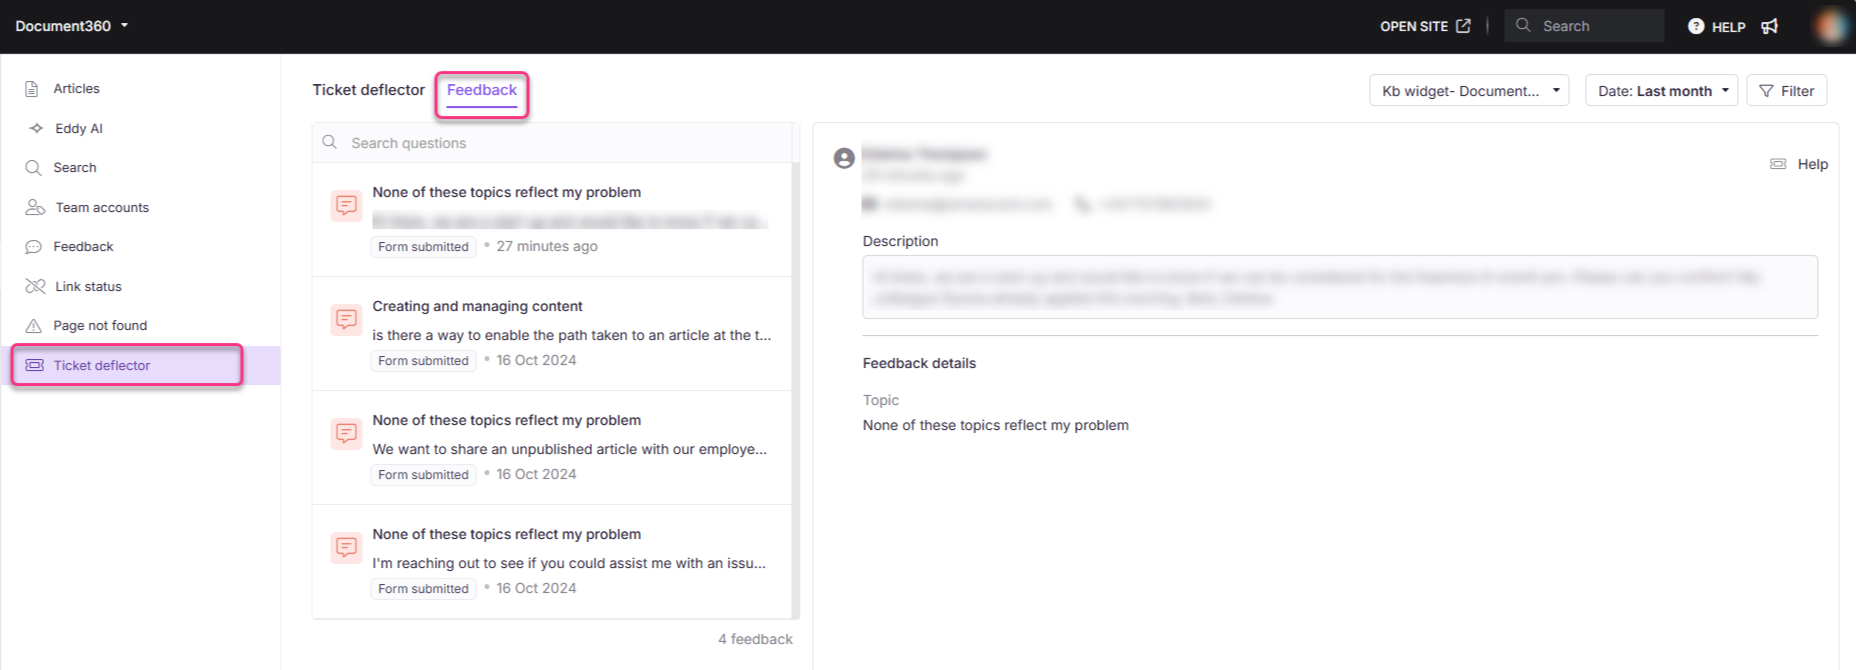
Feedback-Tab
Der Reiter Feedback listet alle Nutzerrückmeldungen auf, die über Ticket-Deflektorformulare eingereicht wurden. Jeder Eintrag ist beschriftet, um seine Quelle (Formular eingereicht oder aus der Wissensdatenbank beantwortet) anzuzeigen und zeigt Datum und Uhrzeit des Eingangs an. Klicken Sie auf einen Eintrag, um den vollständigen Feedback-Inhalt einzusehen.
Best Practices
- Überwachen Sie regelmäßig die Antwort-Metrik aus der Wissensbasis. Eine steigende Zählung bedeutet, dass Ihre Wissensbasis Tickets effektiv ablenkt. Eine stagnierende oder sinkende Anzahl signalisiert, dass Inhalte aktualisiert werden müssen.
- Überprüfen Sie den Bereich Schlüsselwörter für Einträge "Antworten nicht gefunden". Das sind direkte Inhaltslücken. Erstellen oder verbessern Sie Artikel, um diese Suchbegriffe abzudecken.
- Verwenden Sie häufig ausgewählte Fragen, um Ihre Inhalte auszurichten. Wenn immer wieder dieselben Fragen auftauchen, stellen Sie sicher, dass diese Themen gut behandelt und leicht in Ihrer Wissensdatenbank zu finden sind.
- Überprüfen Sie die nützlichsten Artikel nach der Veröffentlichung neuer Inhalte. Wenn ein neuer Artikel hier trotz eines relevanten Themas nicht erscheint, überprüfen Sie dessen Titel und Schlüsselwörter auf Suchbarkeit.
- Filtern Sie nach Widget versus Wissensdatenbank, um Ablenkraten zu vergleichen. Wenn die Widget-Ablenkung deutlich geringer ist, muss der Inhalt oder die Konfiguration Ihres Widgets möglicherweise beachtet werden.
FAQ
Was ist ein Ticketdeflektor?
Ein Ticket-Deflector ist eine Funktion, die Support-Tickets reduziert, indem relevante Knowledge Base-Artikel angezeigt werden, während ein Nutzer ein Ticketformular ausfüllt. Wenn die vorgeschlagenen Artikel ihre Frage beantworten, kann der Nutzer das Formular verlassen, ohne ein Ticket einzureichen. Um einen einzurichten, siehe Formular zum Erstellen eines Ticketdeflektors.
Wie funktioniert der Ticket-Deflektor?
Während ein Nutzer das Ticketformular eingibt, durchsucht das System die Wissensdatenbank mit Schlüsselwörtern aus seiner Anfrage und zeigt vorgeschlagene Artikel an. Wenn ein vorgeschlagener Artikel das Problem löst, kann der Nutzer das Formular schließen, ohne ein Ticket einzureichen.
Was stellt die Antwort-aus der Wissensdatenbank-Metrik dar?
Es zeigt die Anzahl der Anfragen, die durch vorgeschlagene Knowledge Base-Artikel gelöst wurden, ohne dass der Benutzer ein Ticket einreichen muss. Eine höhere Anzahl zeigt, dass Ihre Wissensdatenbank Supportanfragen effektiv abwehrt.
Wie wird die Erfolgsquote der Suche berechnet?
Die Sucherfolgsrate vergleicht die Gesamtzahl der im Ticket-Deflektor-Formular durchgeführten Suchen mit der Zahl, die mindestens einen relevanten Artikel zurückgegeben hat. Suchanfragen, die Ergebnisse liefern, werden als erfolgreich klassifiziert; diejenigen, die nichts zurückgeben, gelten als erfolglos.