Plans supporting this feature: Professional Business Enterprise
The AI Chart generator in Document360 allows you to automatically convert text into various visual formats, such as pie charts and flow charts. This feature streamlines the process of creating charts, eliminating the need for third-party tools and saving time in generating visual aids directly within your articles.
Prerequisites
To use the AI Chart generator, you must meet the following requirements:
You must have an active subscription to the Eddy AI content suite.
The AI writer suite must be enabled in your Document360 account.
Ensure that the text or table you want to convert is within the main body of your article. Text within comments or image captions cannot be used for chart generation.
NOTE
To know more about the languages supported by Eddy AI, click here.
Creating charts from text
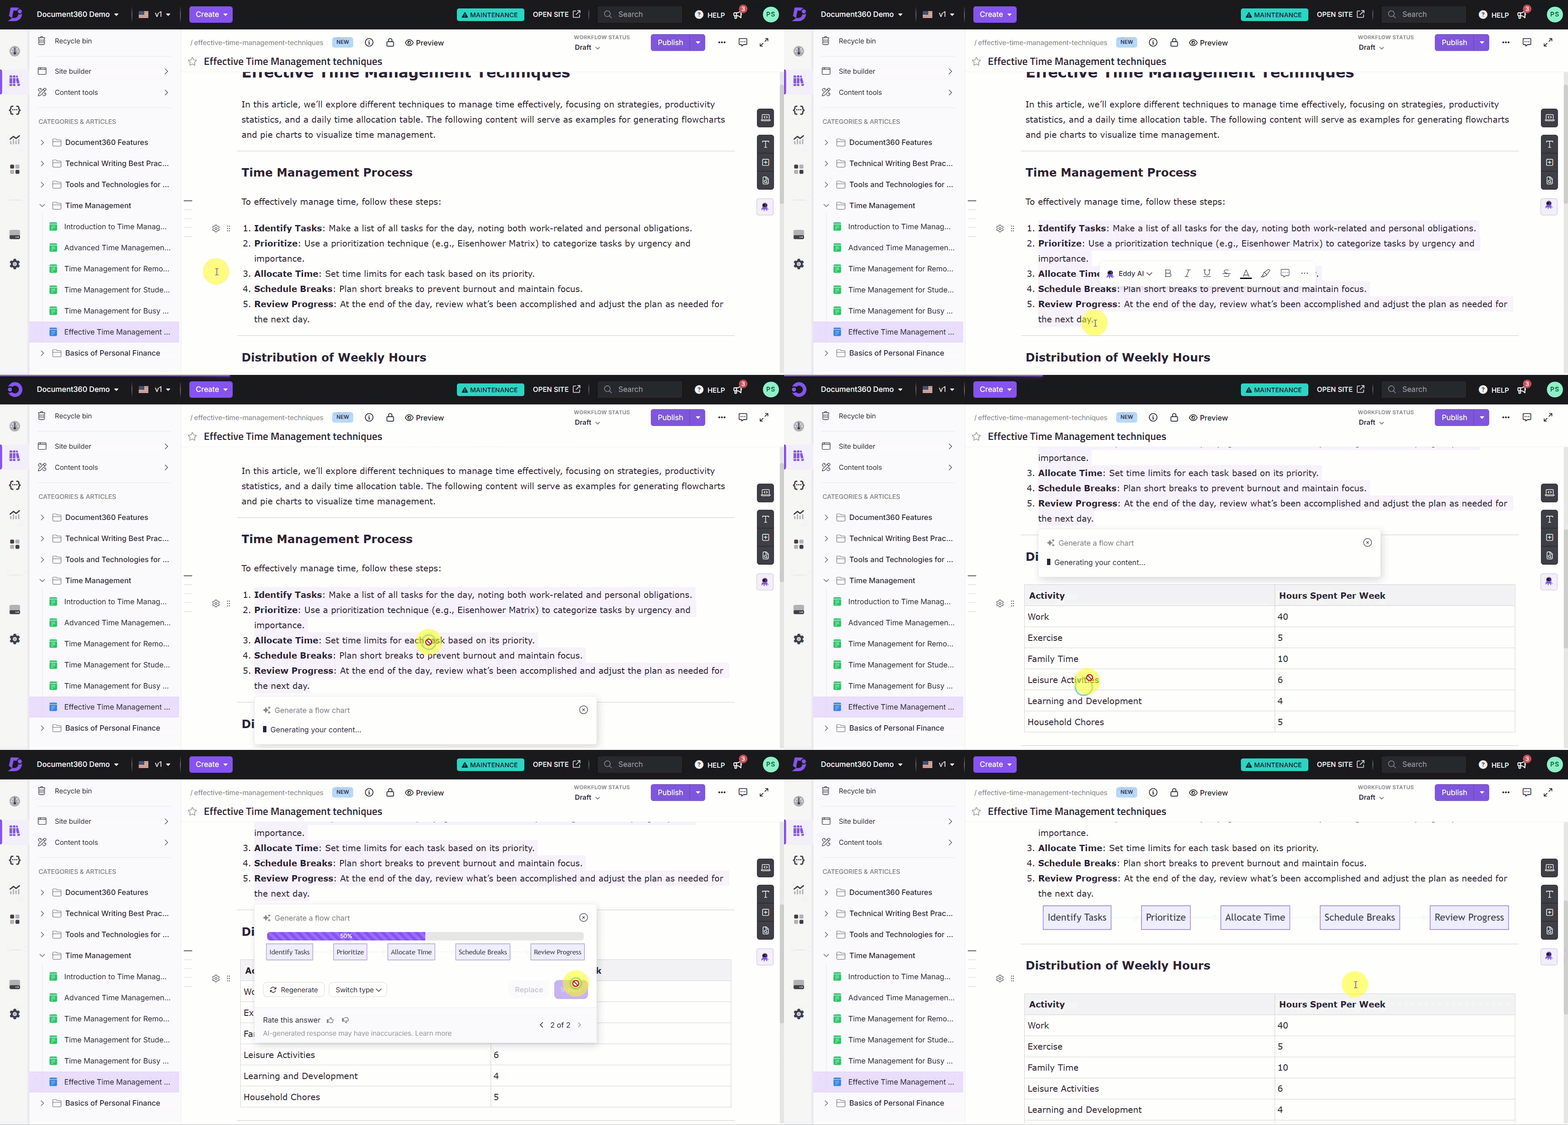
In the Advanced WYSIWYG editor, highlight the content you want to turn into a chart.
Click the Eddy AI option in the floating bubble menu and select the Generate option from the dropdown menu.
Choose the type of chart you want to generate. Available options include Pie chart, Flow chart, and Table.
The system will create a chart of the highlighted text based on your selection. If the generated chart is not satisfactory, you can regenerate it up to 10 times. Regenerations are tracked and displayed in tabs, allowing you to review previous versions and select the best one.
Once you are satisfied with the generated chart, you can either replace the selected text or insert the chart below the selected text as an image within your article.

NOTE
If the system fails to generate the chart, an error message will be displayed: "No results found. Please revise the content or add more context and try again." You can dismiss the error message by clicking elsewhere on the screen or the close button.
Creating charts from tables
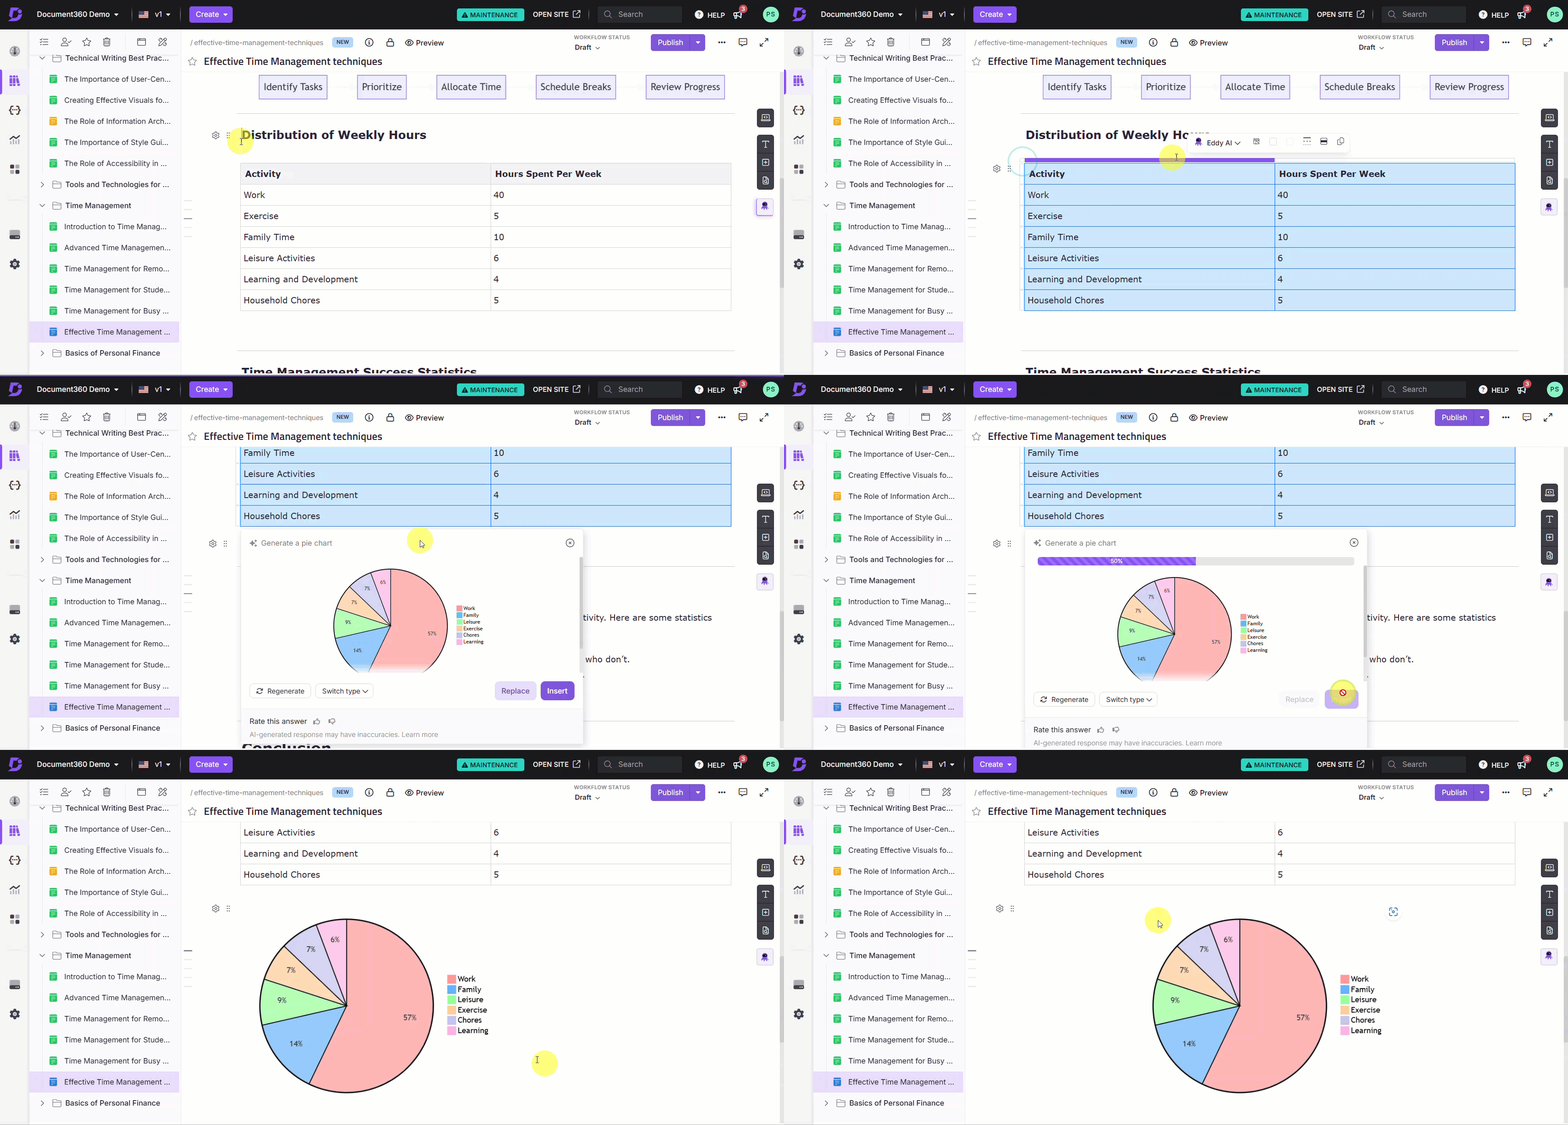
Highlight the table you want to convert into a chart.
Click the Eddy AI option in the floating bubble menu and select the Generate option from the dropdown menu.
Choose the type of chart you want to generate. Available options include Pie chart, Flow chart, Table.
The system will create a chart of the highlighted text based on your selection. If the generated chart is not satisfactory, you can regenerate it up to 10 times. Regenerations are tracked and displayed in tabs, allowing you to review previous versions and select the best one.
After generating the chart, you can either replace the table or insert the chart below the table as an image.

NOTE
The final generated chart which you use in your article is saved in the Document360 Drive, allowing you to reuse it in other articles if needed.
Customizing charts
After generating a chart, you can customize its appearance using the editing options available for images in Document360:
Alignment and positioning: Use the bubble menu to adjust the alignment or inline positioning of the chart.
Edit chart: You can edit the chart using the image editing options in the editor, such as cropping, resizing, or adding annotations.
NOTE
Although the chart cannot be edited directly once inserted into the article, you can undo the action, update the content, and generate a different result, or regenerate the chart using the same text but with a different chart type.
Undo option: If you accidentally replace content with a generated chart and want to revert, use the Undo (Ctrl+Z) option to restore the original content.
Supported chart types
Document360 currently supports the following chart types:
Pie charts
Use case: Show the distribution of parts within a whole. Useful for visualizing proportions, such as categories, percentages, or data segments.
Example: Display the percentage of tasks completed by different team members.
Flow charts
Use case: Map out processes, workflows, or decision sequences. Ideal for illustrating step-by-step procedures or decision trees.
Example: Outline the steps involved in a document approval process or a user onboarding workflow.
Tables
Use case: Present structured data for easy comparison. Ideal for displaying data sets, such as comparisons or performance metrics.
Example: Compare product features, service levels, or user feedback across different categories.
File naming convention
All generated charts will follow a standardized naming convention. The file name will be AI generated based on context, or the selected content. The file name will be appended with the chart type. For example - sales_data_pie_chart.png.
FAQs
Can I edit a generated chart?
No, once a chart is generated, it cannot be edited directly. However, you can regenerate the chart with updated content or switch to a different chart type.
What are the possible reasons for chart generation to fail, and how can I fix it?
Chart generation may fail due to:
Insufficient or incomplete data.
Unsupported content (e.g., comments, captions).
Formatting issues or exceeding data limits.
To resolve this, provide more context by using structured lists, numeric data, or grouping information logically (e.g., by region, product type). These text types are ideal for generating accurate charts. If generation fails, revise the content and try again.
Where are the generated charts saved?
The final generated charts used in the article are saved in the Document360 Drive, allowing you to reuse them in multiple articles. The generated charts will be saved to Images > Documentation in the Document360 Drive.
How many times can I regenerate a chart?
You can regenerate charts type up to 10 times. This includes switching between chart types.
Are all versions of generated charts saved?
No, only the final chart that you choose to insert or replace in the document will be saved in the Document360 drive. Charts generated during the regeneration process are not saved unless they are inserted into the article.
Is there an undo option after replacing content with a chart?
Yes, you can use the Undo (Ctrl+Z) option to restore the original content if you are not satisfied after replacing content with a generated chart.
Does the AI Chart generator consume Eddy AI credits?
Yes, each chart generated using the AI Chart generator consumes credits from your monthly Eddy AI credit limit. This includes generating charts from text or tables, as well as regenerating charts to try different types or updated visuals. Each generation or regeneration counts as one credit deduction from your monthly credit allowance under the Eddy AI content suite.