User analytics in Document360 gives you a detailed view of each team member's activity in the knowledge base portal, including their contributions, portal role, and last contribution date. Use it to track content output across your team, identify top contributors, and monitor publishing activity over time. You can access User analytics from the Analytics () section in the knowledge base portal. To know about reader analytics, go to Reader analytics.
Why use user analytics
- Use user analytics when you want to measure how much each team member has contributed to your knowledge base over a specific period.
- Use it when you need to identify top performers or spot team members who may need support or reassignment.
- Use it when you want to review the articles a specific user has contributed to, along with reader engagement data such as views, reads, likes, and dislikes.
Access user analytics
- In the knowledge base portal, navigate to Analytics () in the left navigation bar.
- In the left navigation pane, click Users.
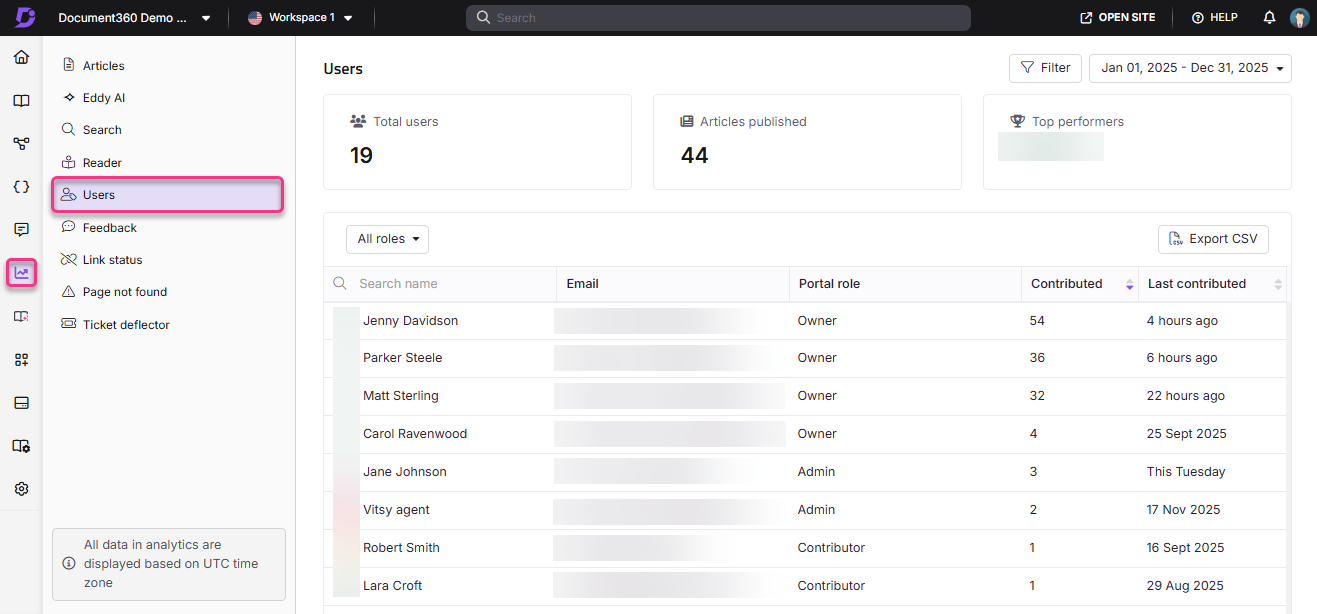
The User analytics page opens, displaying data for the last 7 days by default.
Apply filters
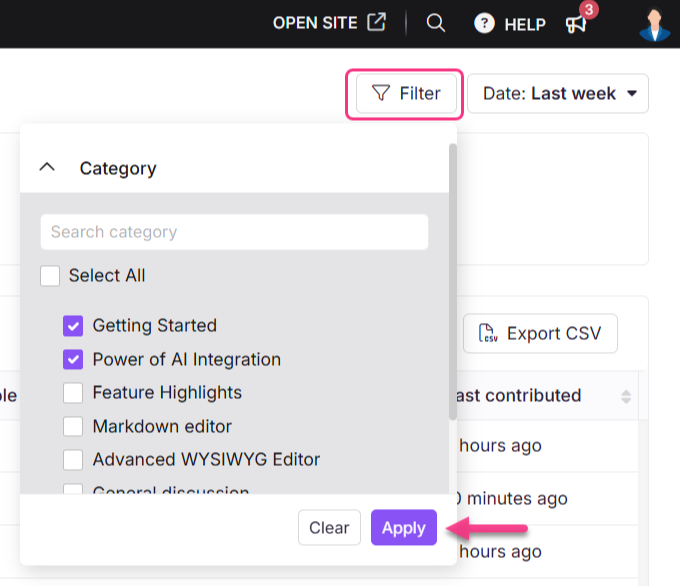
- Click the Date filter dropdown and select a predefined range (such as This month or Last month), or choose Custom to specify a date range.
- Click Filter to narrow down analytics data based on categories in the knowledge base workspace.
User analytics data can take up to 15 minutes to reflect in the knowledge base portal.
User analytics metrics
The User analytics page displays three metric tiles:
| Field | Description |
|---|---|
| Total users | Number of active users in the project. Deleted users are excluded from this count. |
| Articles published | Number of articles published in the selected date range. |
| Top performers | Profile images of the top-contributing team members, ranked by number of articles contributed. |
The table below the tiles lists all team members with the following details:
| Field | Description |
|---|---|
| Name | Profile picture and name of the user, along with their account type (normal or SSO). Click the name to view the user's individual contribution details. |
| Email address of the user. | |
| Portal role | The role assigned to the user in the portal (Owner, Admin, Contributor, and others). |
| Contributed | Total number of articles the user contributed during the selected time frame. |
| Last contributed | Time of the user's most recent contribution, shown relative to the current time (for example, "4 minutes ago" or "This Monday"). For contributions older than a week, the exact date is shown (for example, "Nov 16, 2024"). |
View individual user contributions
-
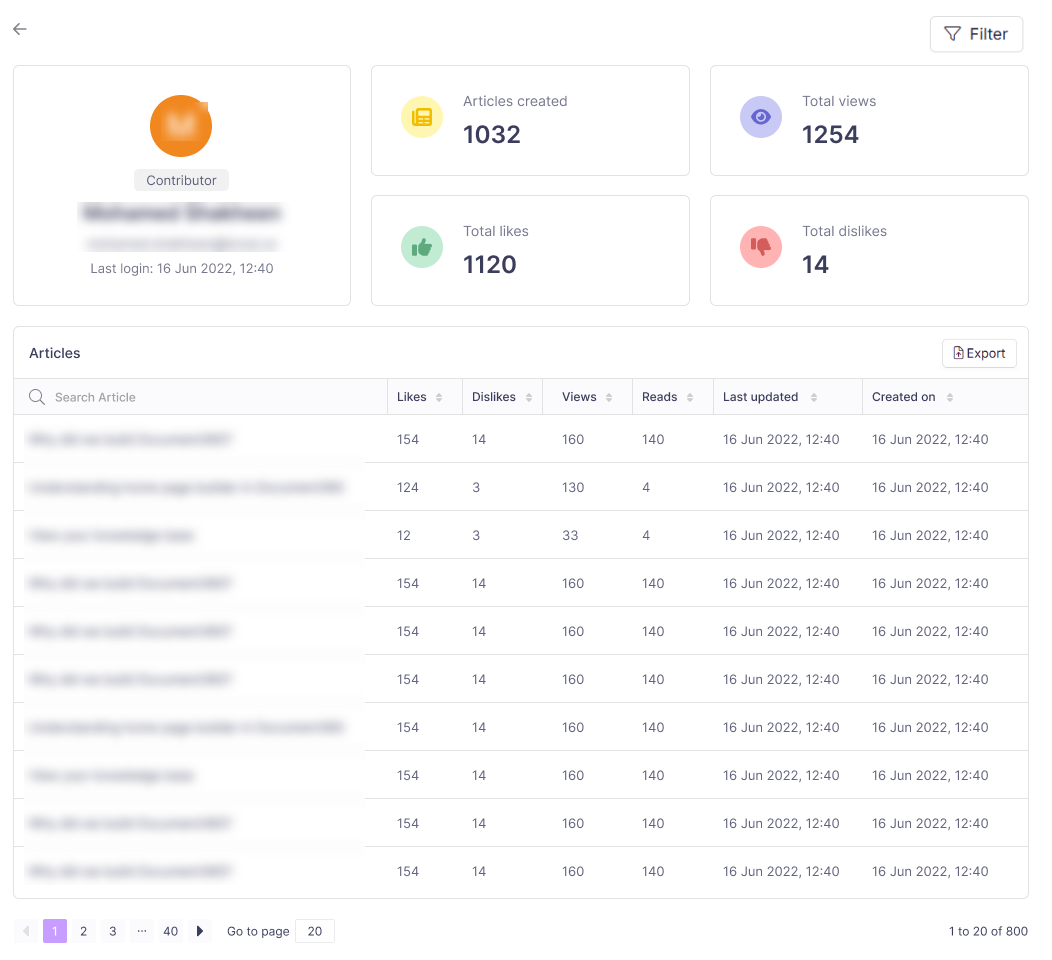
Click a user's name to open their individual contribution details. The following information is displayed:
- Profile: Name, profile image, email, portal role, and last login date and time (UTC).
- Contribution performance: Four tiles showing Articles created, Total views, Total likes, and Total dislikes. Deleted articles are excluded from these counts.
- Articles: A list of article names the user has contributed to, with Views, Reads, Likes, Dislikes, Created on, and Last updated date.
-
Click Filter to narrow down the articles list. The following filter options are available:
- Article type: All, Page, Article
- Date: 7 days, 30 days, Custom date
- Read receipt status: All, Yes, No (available for Private and Mixed projects only)
- Category: All categories in the workspace
-
Click Apply to apply the selected filters.
-
Hover over an article title and click View in knowledge base () to open the article on the knowledge base site.
Export user analytics data
- To export the full user analytics list, click Export CSV on the Users page. The file is saved to your local storage in
.csvformat. - To export an individual user's analytics, click the user's name and then click Export above the articles list.
Best practices
- Review contribution data by date range. Use the Date filter to compare team output across different periods, such as before and after a documentation sprint.
- Use individual profiles to assess article quality. High contribution counts with low views or reads may indicate that articles need better discoverability or restructuring.
- Filter by category when managing large teams. Narrowing data to a specific category helps you evaluate contribution coverage for a particular section of your knowledge base.
- Export CSV data for team reporting. Use exported data to share contribution summaries with managers or during team reviews without needing direct portal access.
- Check last login and last contributed dates together. A user who is active in the portal but has not contributed recently may benefit from a check-in or reassignment.
FAQ
Are deleted users included in the Total users count?
No. Deleted users are excluded from the Total users metric. Contribution performance tiles for individual users also exclude counts from deleted articles.
What does the Contributed column show?
It shows the total number of articles the user contributed during the selected date range. You can change the date range using the Date filter to adjust what is counted.
Can I filter a user's article list by read receipt status?
Yes, but only for Private and Mixed projects. In the individual user view, click Filter and use the Read receipt status option to filter by All, Yes, or No.