


Plans supporting the use of ticket deflector
| Professional | Business | Enterprise |
|---|---|---|
The Ticket deflector analytics page provides an overview of all key metrics related to the ticket deflector form(s) in your Knowledge base site or widget.
Accessing the Ticket deflector analytics page
To view Ticket deflector analytics, from the Knowledge base portal,
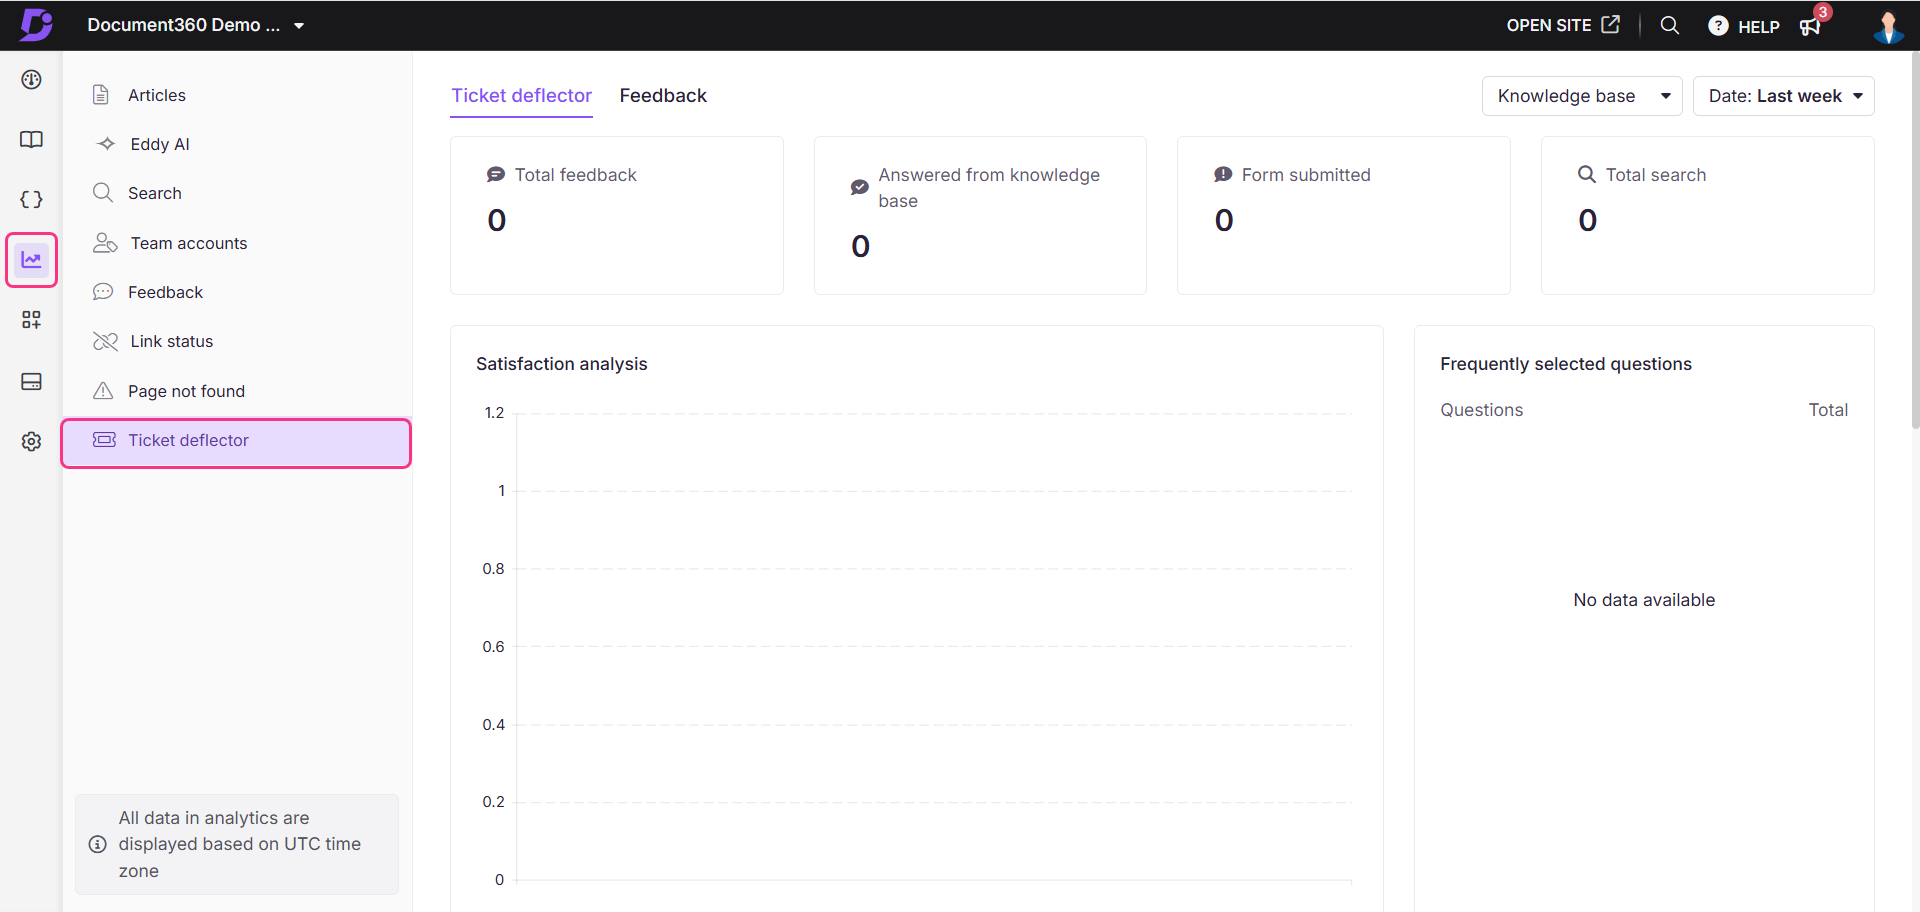
Navigate to Analytics () in the left navigation bar in the Knowledge base portal.
In the left navigation pane, click Ticket deflector.
Using filters to customize data
By default, the data shows metrics for the last week. You can adjust these using filters on both Ticket deflector and Feedback tabs:
Click the Date filter dropdown.
Select a predefined range (e.g., This month, Last month) or choose Custom to specify a date range.
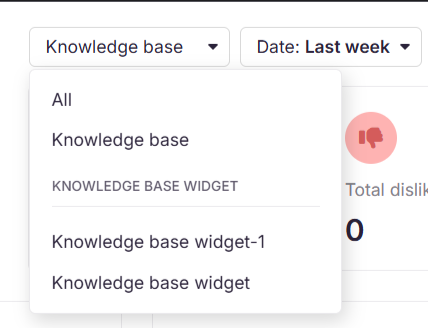
If using the Knowledge base widget, use the top-right dropdown to switch between All, Knowledge base and Widget analytics.
Select the JWT widget to track and analyze user interactions and engagement of reader analytics within private and mixed projects secured by JWT authentication.
For more information on Knowledge base widget JWT authentication, read the article on Managing the Knowledge base widget.
NOTE
Search analytics data can take up to 15 minutes to reflect in the Knowledge base portal.
Ticket deflector tab
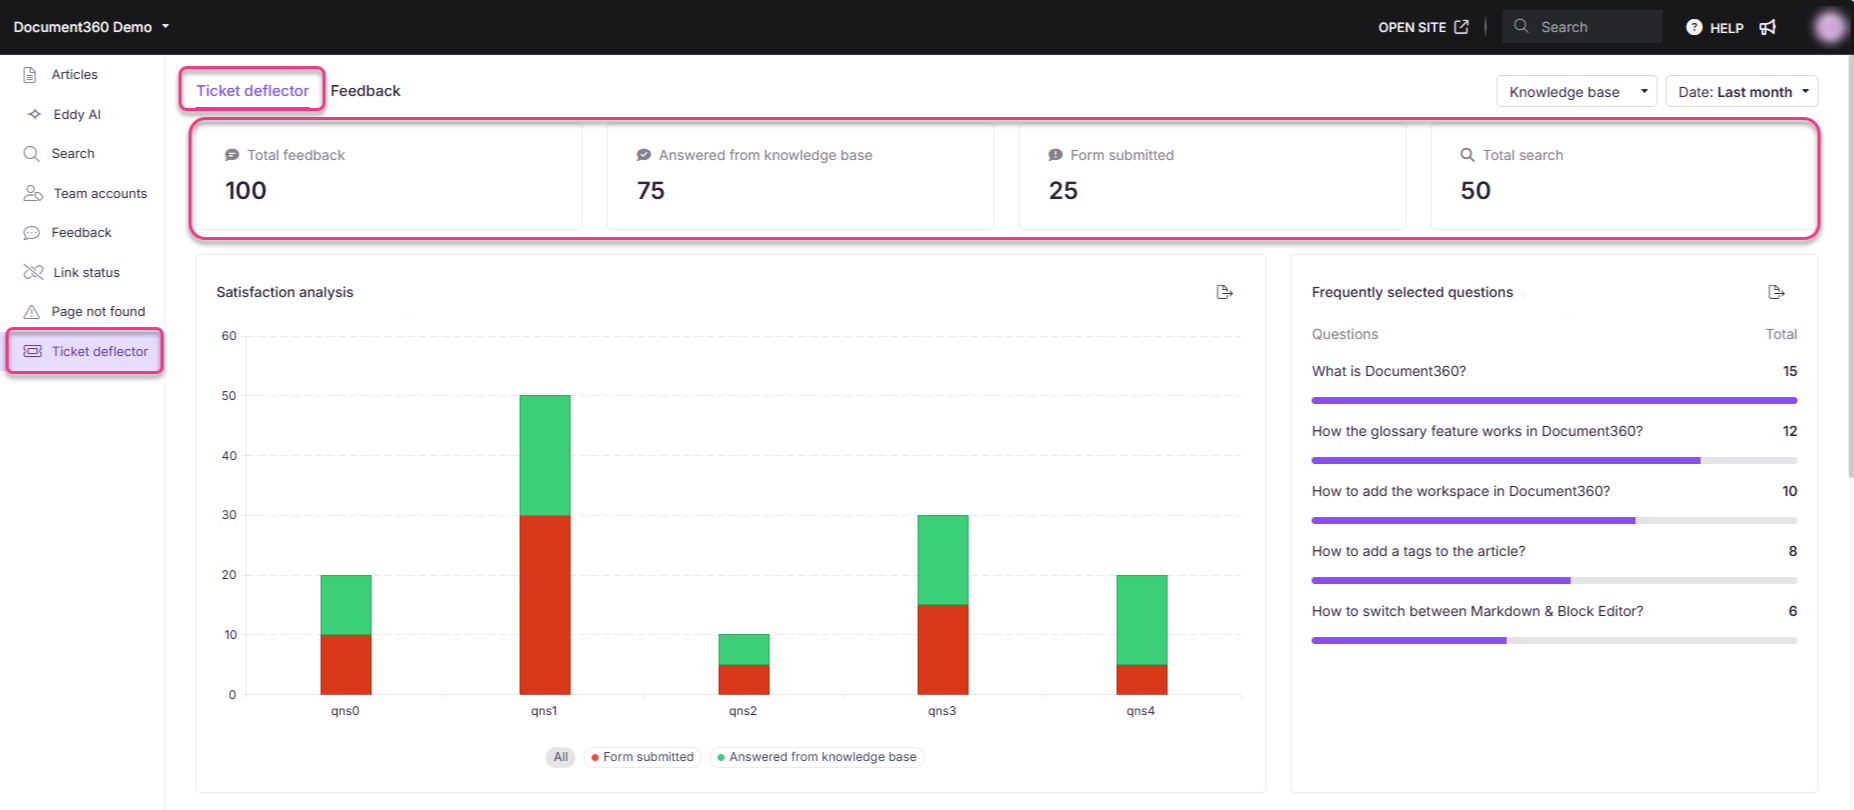
This is the default tab on the Ticket deflector analytics page. The Ticket deflector page shows the below four metric tiles:
Field | Description |
|---|---|
Total feedback | The total number of feedback entries including the responses from the Knowledge base and the number of forms submitted. |
Answered from knowledge base | The number of queries answered by articles in the knowledge base. |
Form submitted | The total number of ticket deflector forms submitted. |
Total search | The total number of searches performed on the Quick support page of the Knowledge base. |
Sections of Ticket deflector tab
The Ticket Deflector tab displays various sections, each highlighting different aspects of its performance.
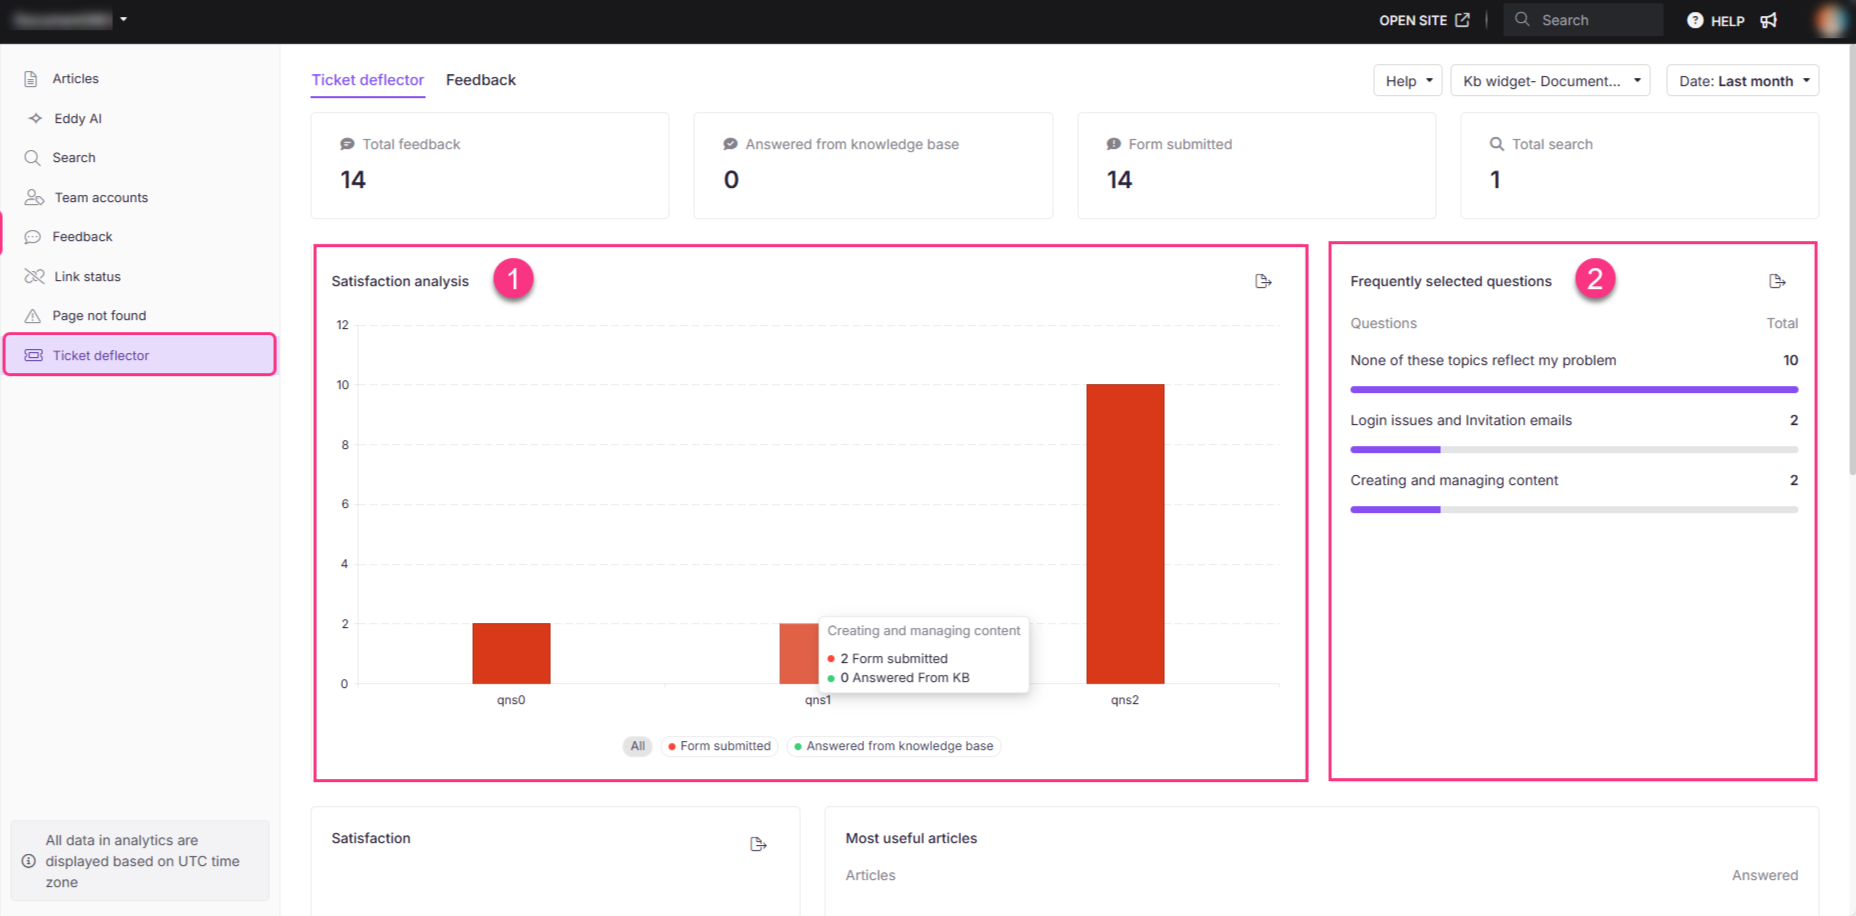
1. Satisfaction analysis
This graph shows the percentage of ticket deflector forms submitted and queries answered from the knowledge base. You can interact with the graphs by clicking on the legends at the bottom:
Field | Description |
|---|---|
All | Click to view the total number of feedback entries including the responses from the Knowledge base and the number of forms submitted. |
Form submitted | Click to view the total number of ticket deflector forms submitted. |
Answered from knowledge base | Click to view the total number of queries answered by articles in the knowledge base. |
Hover over the graph to find the metrics.
Click Export image ( ) to save the section as a PNG image.
2. Frequently selected questions
This section displays the top five most frequently chosen questions from the ticket deflector form. The list shows the questions and how often they were selected. You can export this list using the export () icon.
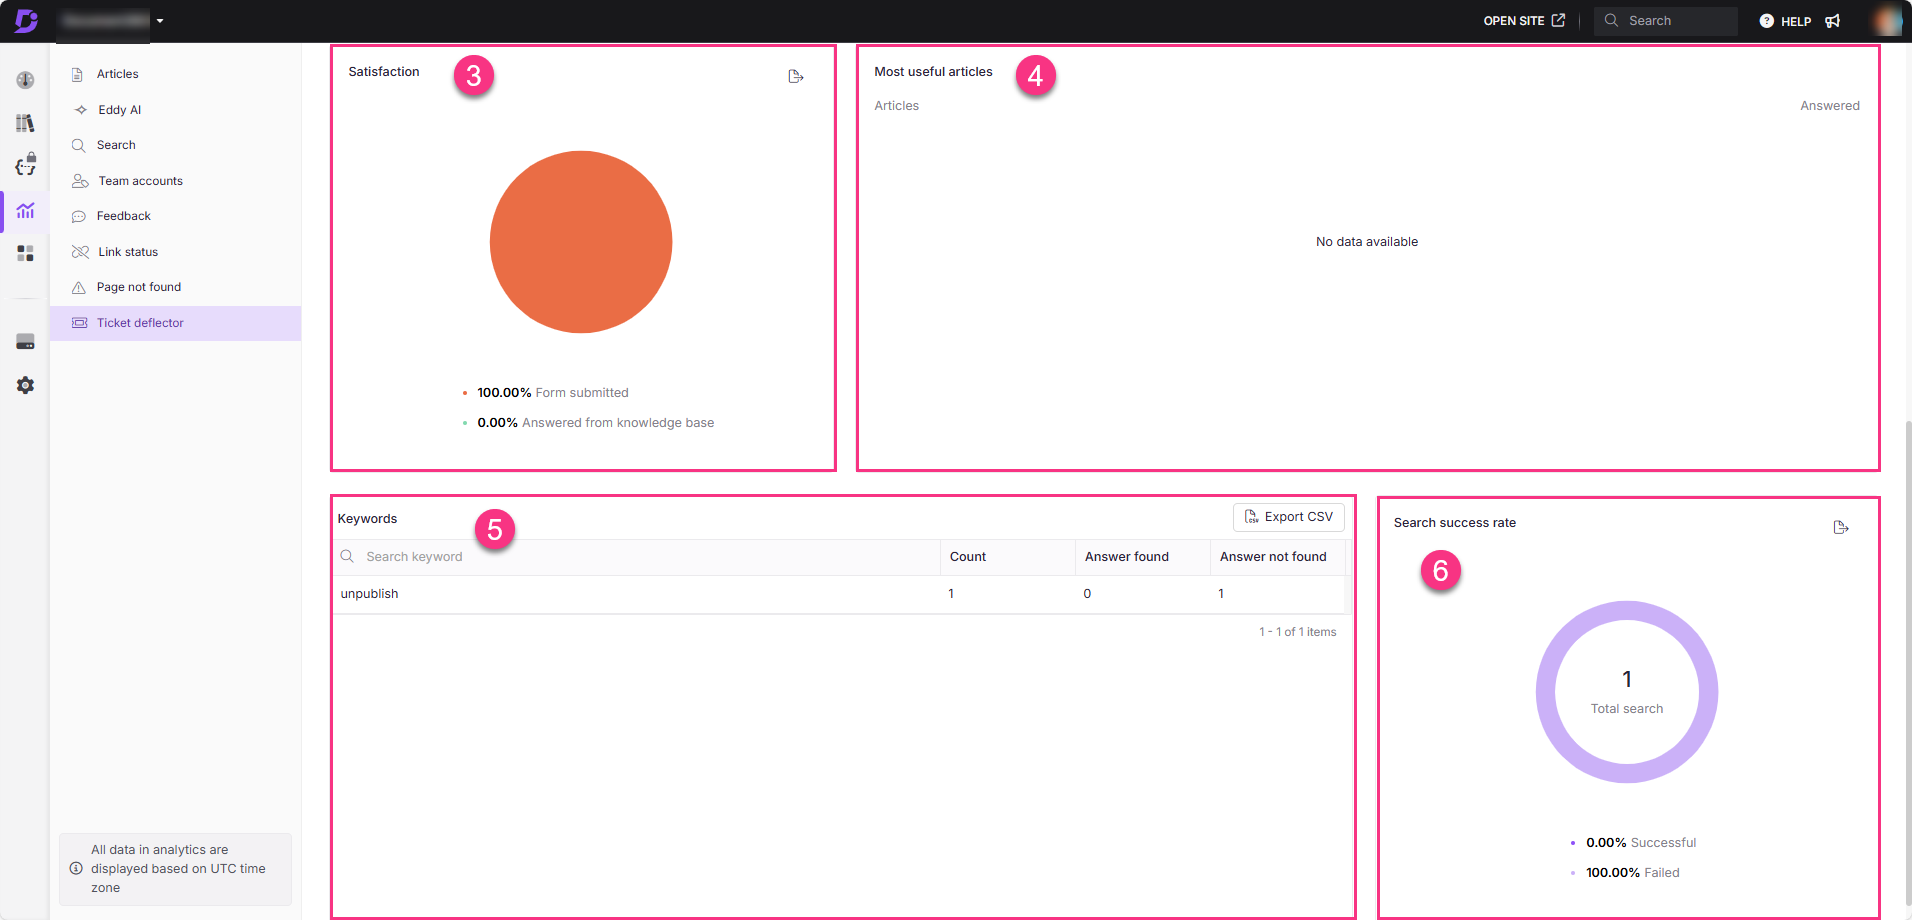
3. Satisfaction
This section displays a pie chart showing the proportion of forms submitted (orange color) and the number of questions successfully answered by the Knowledge base (green color).
Click Export image ( ) to save the section as a PNG image.
4. Most useful articles
This section highlights the top articles that were helpful in resolving queries which represents the queries that produced successful search results. It provides the following details:
Articles: The title of the article.
Answered: The number of queries the article helped resolve.
5. Keywords
In this section, you can view data related to specific keyword searches. The following information is available:
Keyword: The keyword searched by the user.
Count: The number of times the keyword was searched.
Answer found: Indicates whether a suitable answer was found.
Answer not found: Indicates whether the search failed to return an answer.
Click Export CSV to export the articles in the list.
Click the Download () icon to download the last exported file.
6. Search success rate
This section shows the percentage of searches performed using the selected ticket deflector form(s). The chart displays the percentage of successful and unsuccessful searches. Searches that generate results are classified as successful, while those that yield no results are considered unsuccessful.
Click Export image ( ) to save the section as a PNG image.
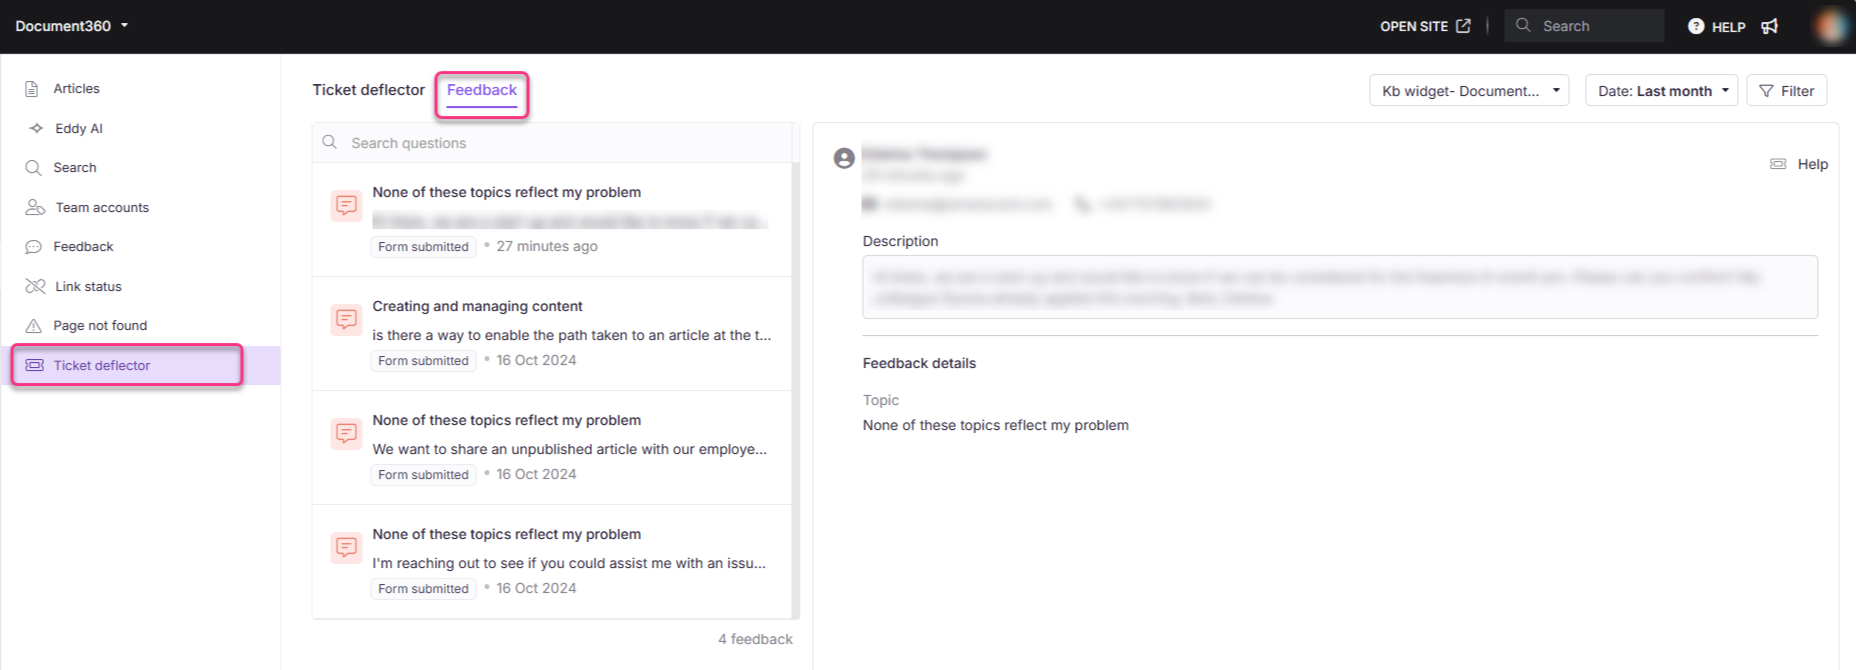
Feedback tab
The Feedback tab displays all user feedback related to ticket deflector forms. Each feedback entry is labeled to indicate its source, such as Form Submitted or Answered from Knowledge Base.
Each feedback entry displays the date and time (in minutes) it was received.
Click open a feedback to view the feedback content.
FAQs
What is a ticket deflector?
A ticket deflector is a feature designed to reduce the number of support tickets by providing users with relevant Knowledge base articles before they submit a ticket. When users begin filling out the ticket form, the system suggests helpful articles that might answer their questions, deflecting the need to raise a support request.
How does the ticket deflector work?
The ticket deflector suggests relevant knowledge base articles based on keywords from the user's query or question. As users type into the form, the system automatically searches the knowledge base and displays suggested articles that may provide the solution, potentially preventing ticket submission.
What does the ‘Answered from Knowledge Base’ metric represent?
The Answered from Knowledge Base metric shows the number of queries that were successfully resolved by the suggested articles in your knowledge base, without the user needing to submit a ticket. This helps measure the effectiveness of your knowledge base in reducing support requests.
How can I improve the effectiveness of the ticket deflector?
To improve the effectiveness of the ticket deflector:
Ensure your knowledge base is up to date with accurate and comprehensive articles.
Use clear and relevant keywords in your articles to improve searchability.
Regularly review and update the Frequently selected questions section to better address common user queries.
Analyze the Search Success Rate to identify gaps in your knowledge base and add or improve articles accordingly.
How is the Search success rate calculated?
The Search Success Rate represents the percentage of searches that returned a relevant article for the user's query. It compares the total number of searches performed with the number of successful searches that resulted in the user finding a helpful article.