Feedback analytics track total comments, likes, and dislikes for each article/page category. You can find the analytical representation of the feedback data in charts and graphs.
Accessing the Feedback analytics page
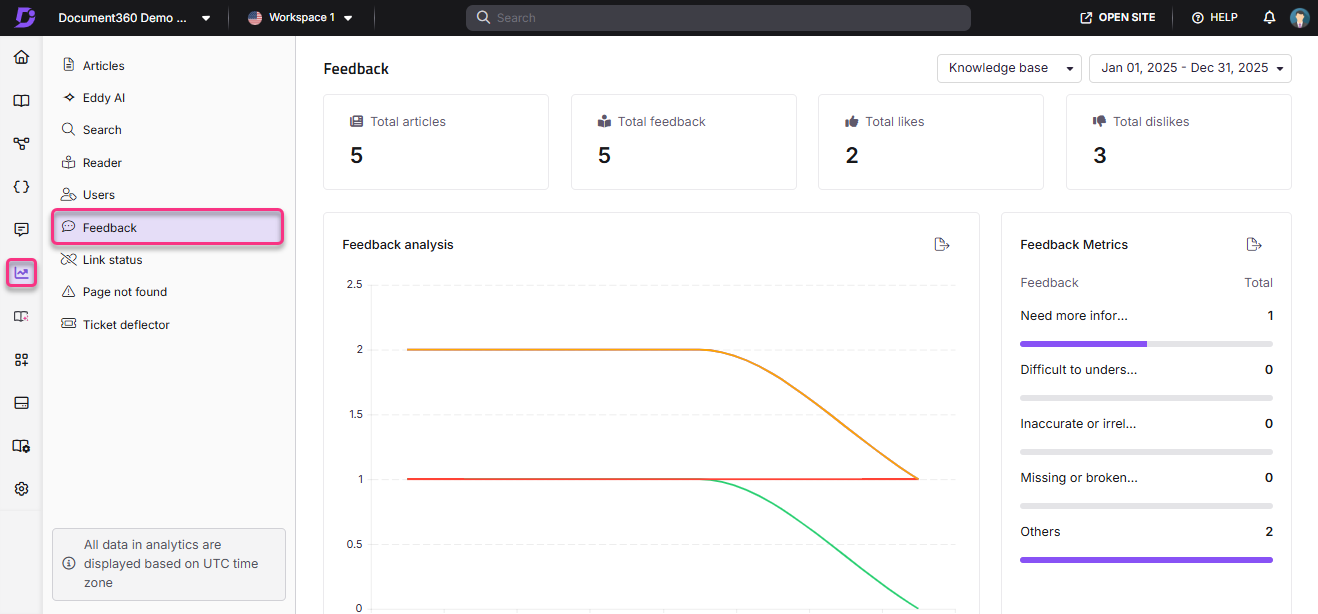
To view Feedback analytics, from the Knowledge base portal,
Navigate to Analytics () in the left navigation bar in the Knowledge base portal.
In the left navigation pane, click Feedback.
Using filters to customize data
By default, the data shows metrics for the last week. You can adjust this using filters:
Click the Date filter dropdown.
Select a predefined range (e.g., This month, Last month) or choose Custom to specify a date range.
Click on the All users dropdown to filter analytics data based on user type.
For Mixed projects, the available filters are All, Users, Public readers, and Private readers.
For Private projects, the available filters are All, Users, and Readers.
For Public projects, this filter will not be available.
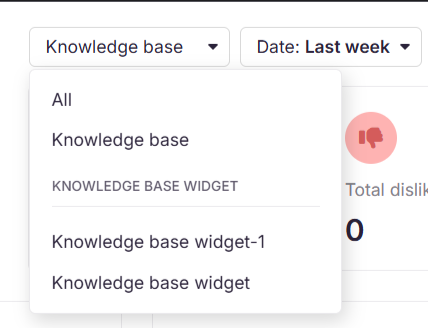
If using the Knowledge base widget, use the top-right dropdown to switch between All, Knowledge base and Widget analytics.
Select the JWT widget to track and analyze user interactions and engagement of Feedback analytics within private and mixed projects secured by JWT authentication.
For more information on the Knowledge base widget JWT authentication, read the article on Managing the Knowledge base widget.
NOTE
Feedback analytics data can take up to 15 minutes to reflect in the portal from the time the feedback is given.
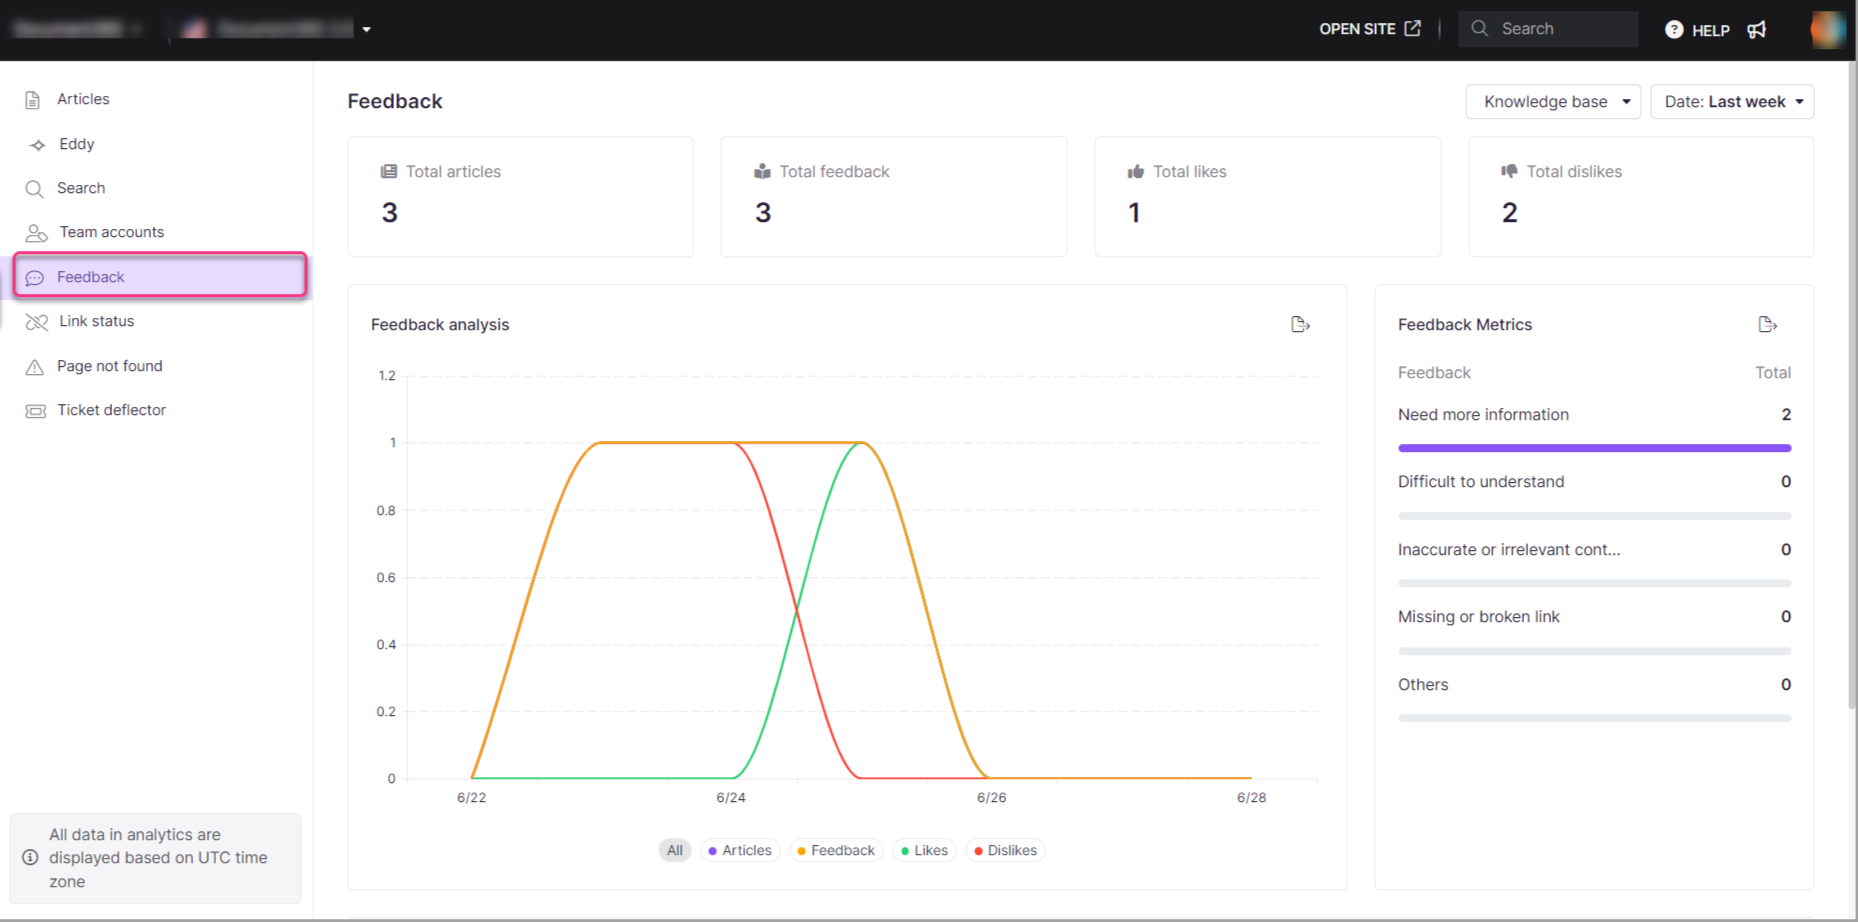
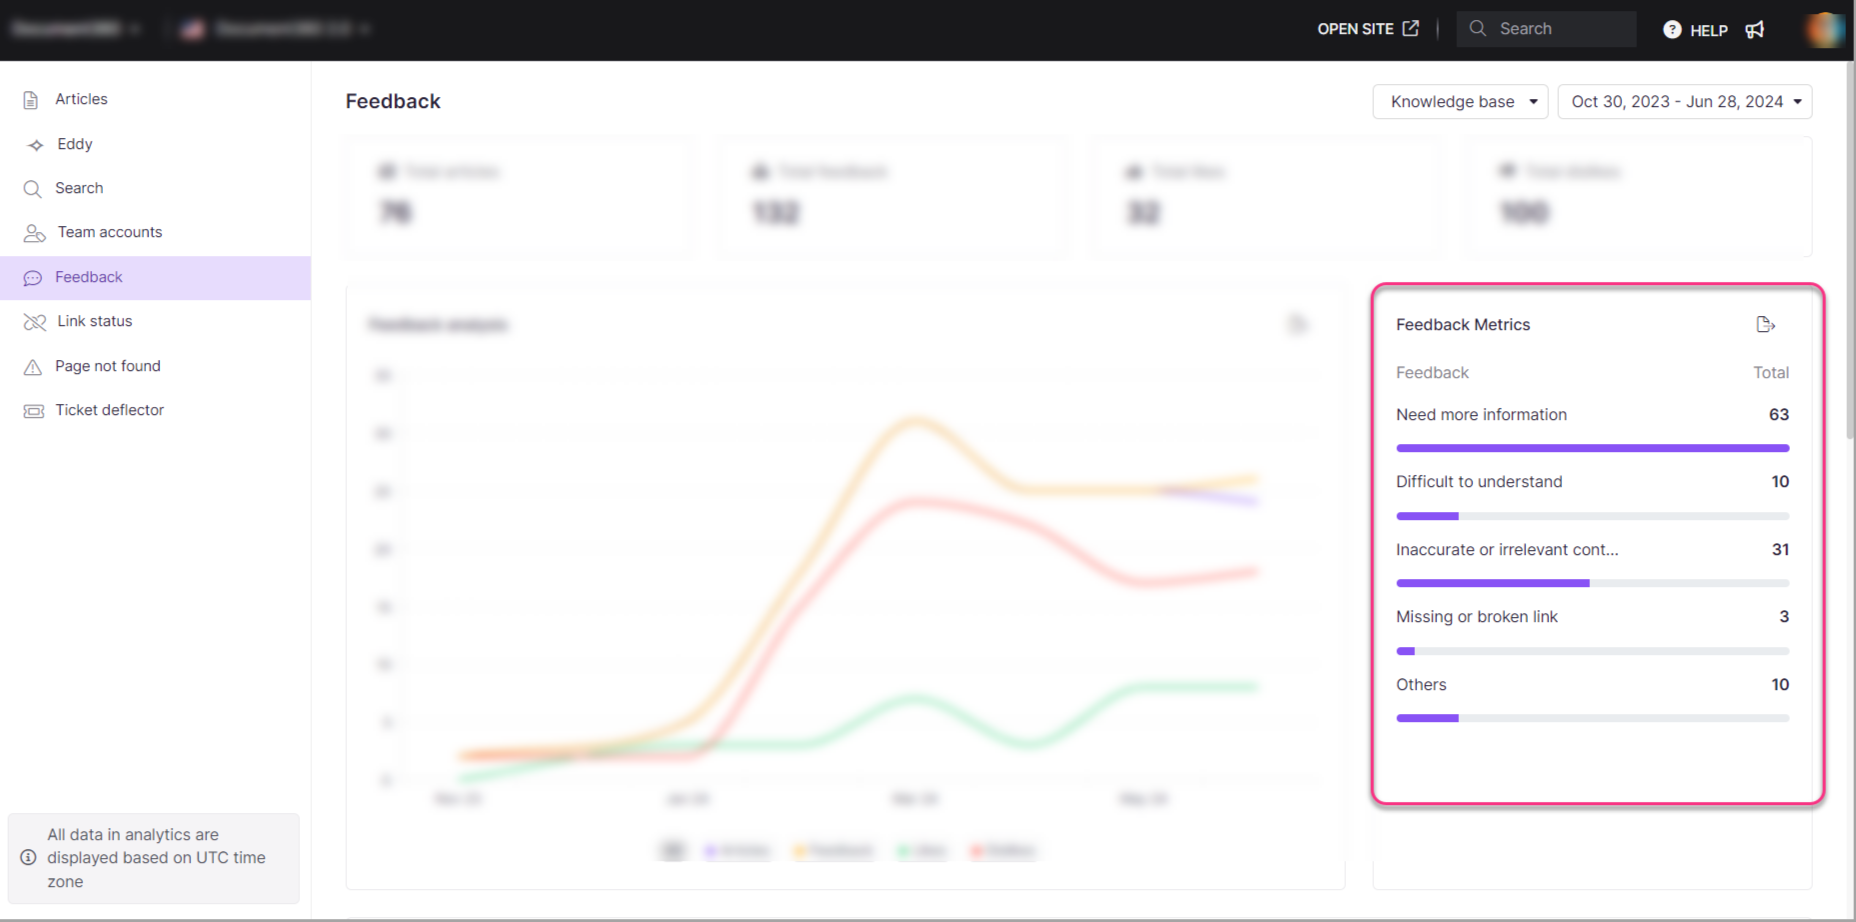
Feedback analysis
The graphical representation of the Feedback analysis is shown below.
The Feedback page shows the following four metric tiles:
Field | Description |
|---|---|
Total article | The number of articles that received some feedback (Like, dislike, or comment) from the readers. |
Total feedback | The number of comments logged. |
Total likes | The number of likes received, which are accompanied by comments from the readers. |
Total dislikes | The number of dislikes received, which are accompanied by comments from the readers. |
NOTE
For Total likes and Total dislikes, if a reader first likes an article and later changes their response to dislike, only the dislike will be captured in the analytics.
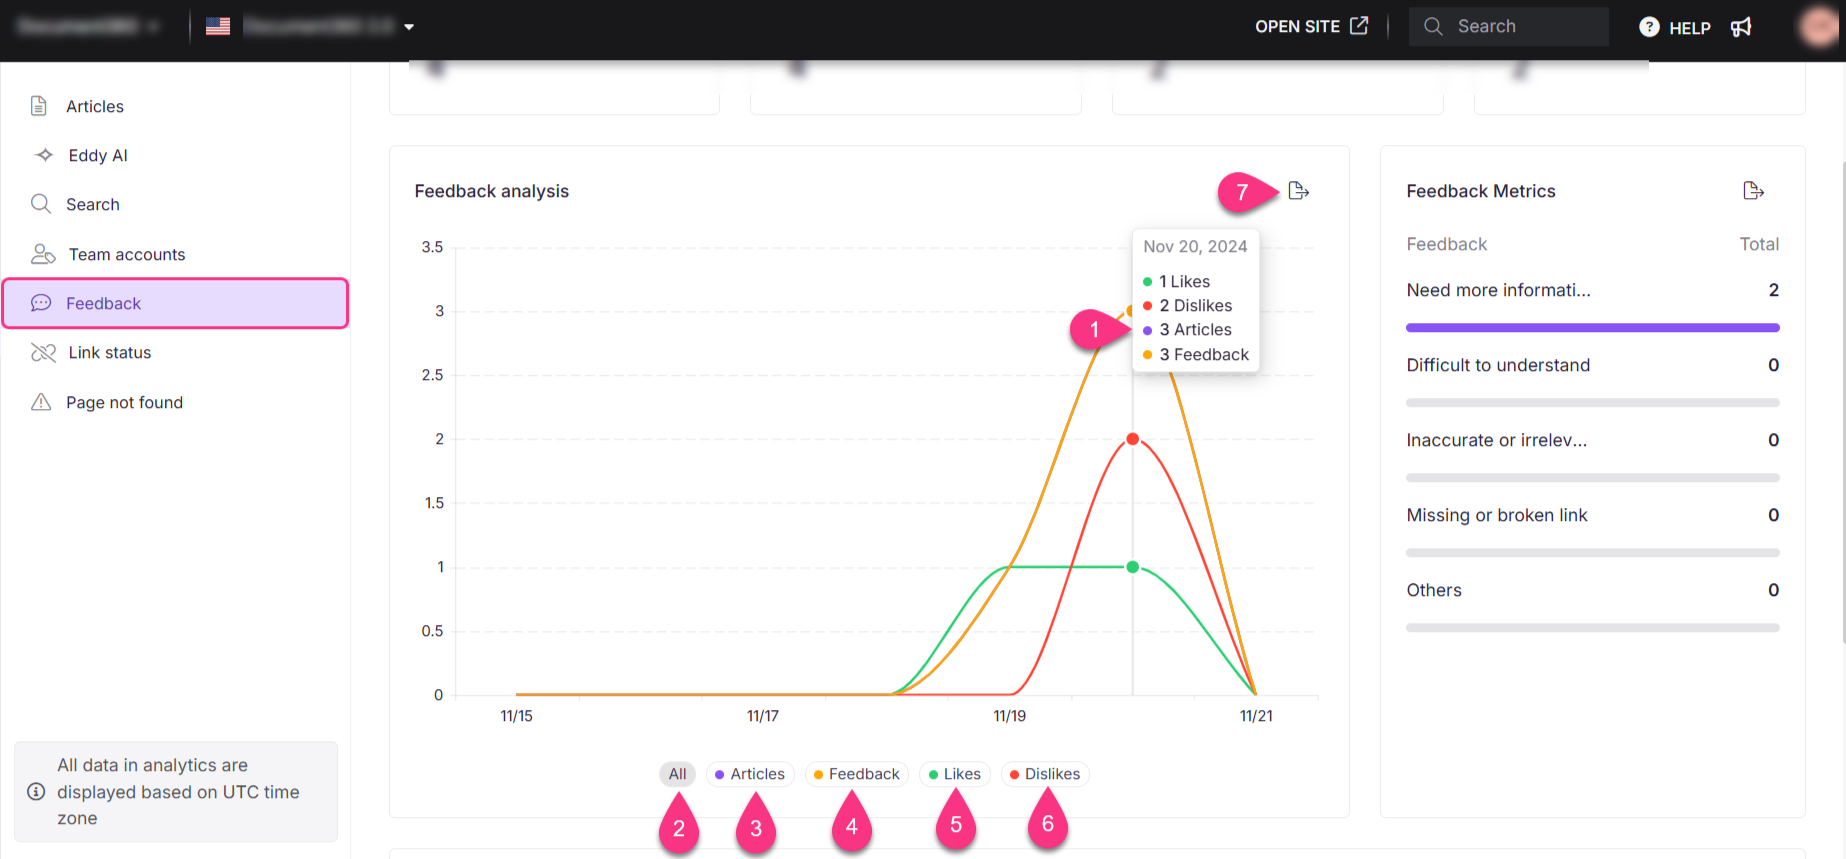
The Feedback analysis displays the following metrics:
Field | Description |
|---|---|
Date-wise metrics | The metrics on a specific date when you hover over the graph. |
All | The graph of all feedback, including articles, likes, and dislikes. |
Articles | The graph of article feedback. |
Feedback | The number of feedback submitted. |
Likes | The graph of likes received. |
Dislikes | The graph of dislikes received. |
Export image | To export the Feedback analysis graph as an image in .png format. |
Feedback metrics
This section displays a graphical representation of reader’s dislike responses, including the specific reasons selected by readers for their feedback. The dislike responses are:
Need more information
Difficult to understand
Inaccurate or irrelevant content
Missing or broken link
Others
Custom feedback messages
The dislike responses mentioned above are the default system responses. You can change the response on the Localization variables page and also view the total count for each type of dislike response selected by readers.
Navigate to Settings() in the left navigation bar in the Knowledge base portal.
In the left navigation pane, navigate to Knowledge base portal > Localization & Workspaces > Localization variables.
For more information, read the article on Localization variables.
Feedback list
Here, the list of articles, along with the feedback information, is displayed. The information available in this section are
Article name
Proportion (Likes vs. Dislikes out of 100)
The total article views in the selected time frame
Likes received with feedback or comments
Dislikes received with feedback or comments
Feedback or comments received
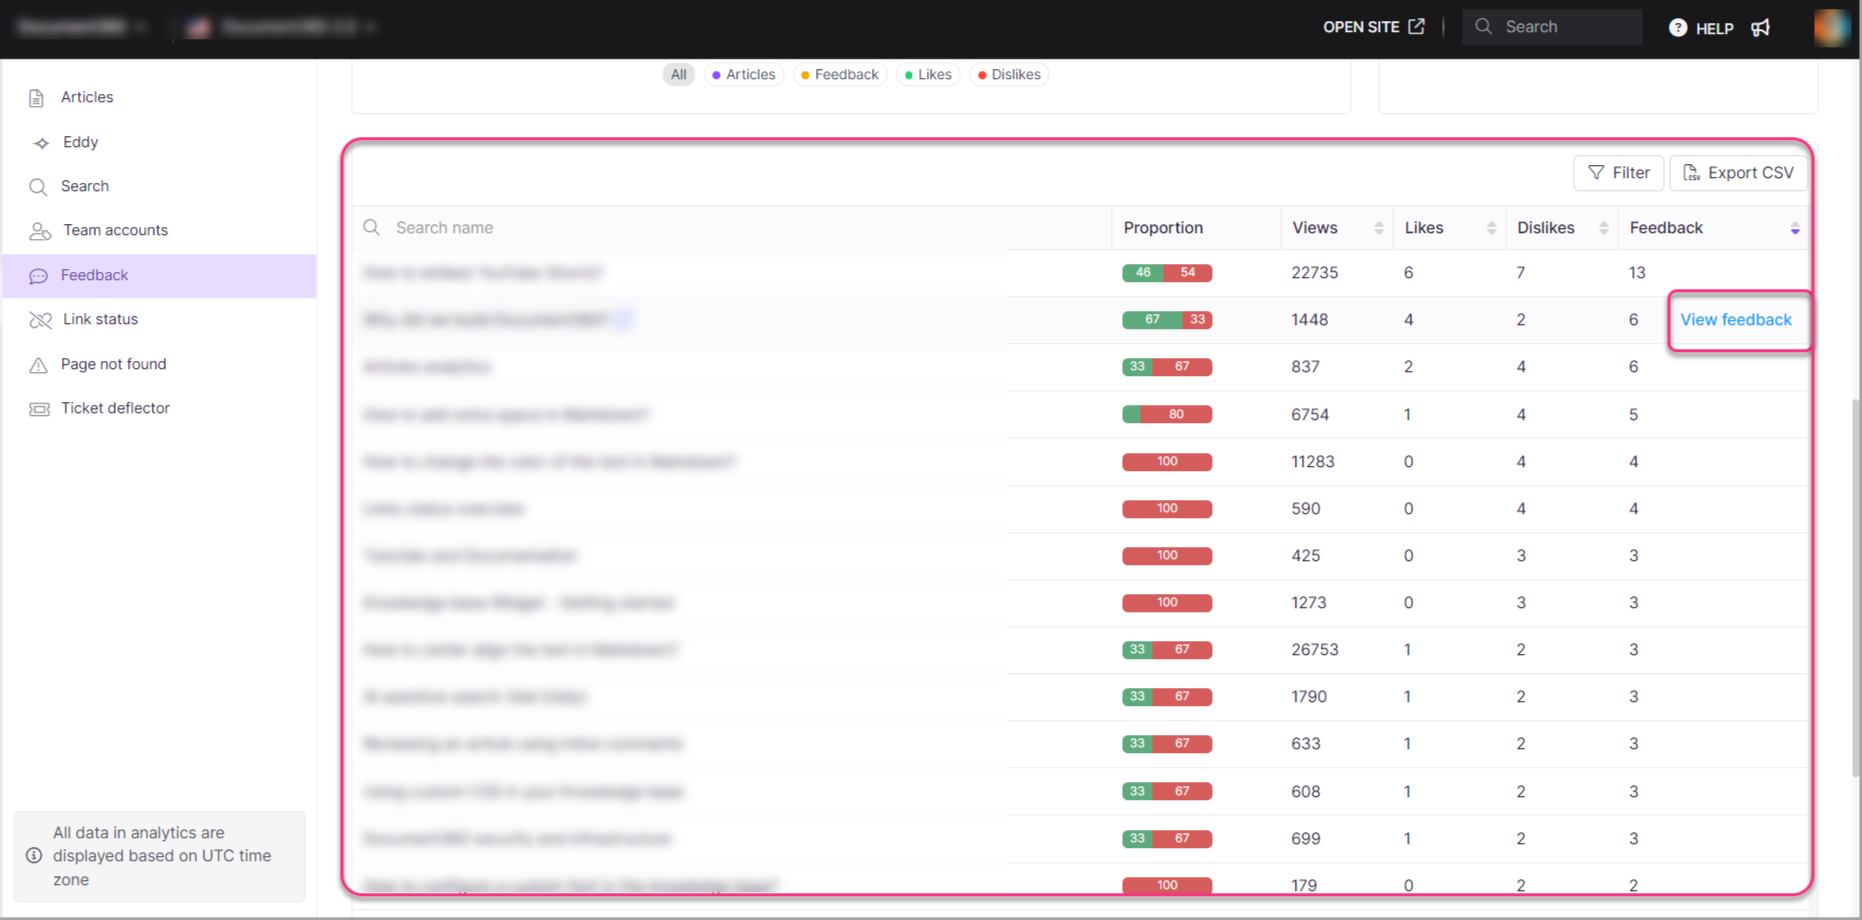
The actions you can perform from this section are:
View in Knowledge base: Hover over an article title and click View in Knowledge base () to open the article in the Knowledge base site.
View feedback: This appears at the end of the row when you hover your pointer over the article. Clicking View feedback redirects you to the Feedback manager.
Filter: You can filter the list based on articles, page categories, or both.
Export CSV: Click to export and download the reader analytics as a CSV file to your local storage.
FAQ
Are feedback submissions without comments included in the metrics displayed on the Feedback Manager tiles?
No, any feedback without a comment will not appear in the metrics reflected on the Feedback Analytics tiles. Only feedback submissions that include both a thumbs up/thumbs down response and a comment are counted in the Feedback analytics data.