


Plans supporting article analytics
| Professional | Business | Enterprise |
|---|---|---|
The Articles analytics page in Document360 offers detailed insights into the performance of your articles, including overall article data, geographic distribution, and top-performing categories and articles. This valuable data can help you understand user engagement, identify popular content, and make data-driven decisions for improving your Knowledge base.
Accessing Articles analytics
To access the Articles analytics page:
From the Knowledge base portal, navigate to Analytics ()> Articles.
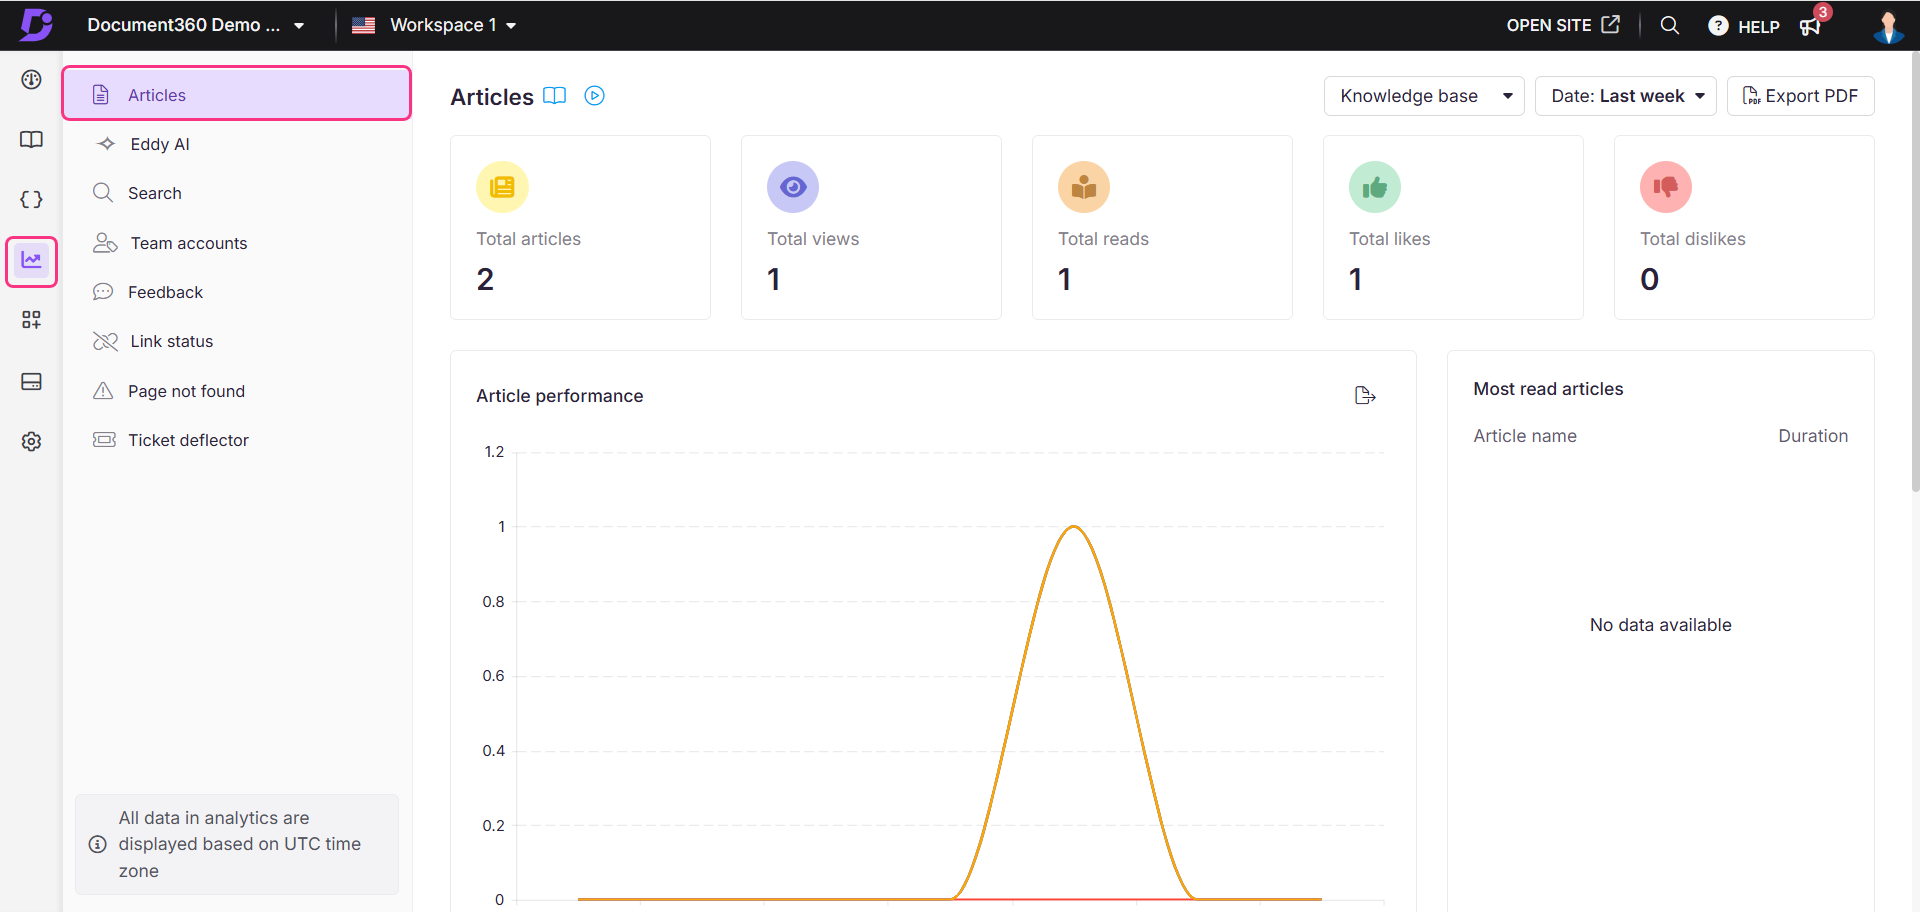
The Articles analytics page opens with an overview of article data. This data is specific to the current workspace and language.
Using filters to customize data
By default, the data shows metrics for the last week. You can adjust this using filters:
Click the Date filter dropdown.
Select a predefined range (e.g., This month, Last month) or choose Custom to specify a date range.
Click on the All users dropdown to filter analytics data based on user type.
For Mixed projects, the available filters are All, Team accounts, Public readers, and Private readers.
For Private projects, the available filters are All, Team accounts, and Readers.
For Public projects, this filter will not be available.
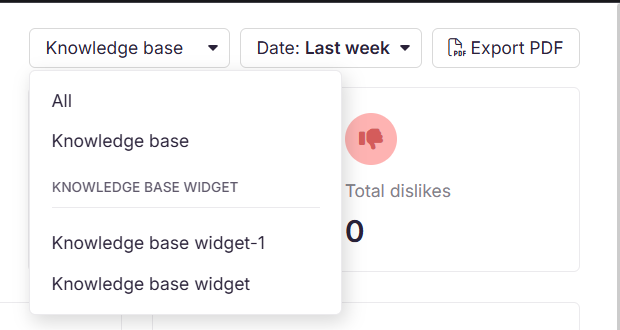
If using the Knowledge base widget, use the top-right dropdown to switch between All, Knowledge base and Widget analytics.
Select the JWT widget to track and analyze user interactions and engagement of Feedback analytics within private and mixed projects secured by JWT authentication.
For more information on Knowledge base widget JWT authentication, read the article on Managing the Knowledge base widget.
NOTE
Article analytics data can take up to 15 minutes to reflect in the portal.
Article performance
The following performance information of the articles is available in this section as tiles based on the filters applied. Total views, total reads, total likes and total dislikes here in this section are cumulative metrics which include the total including the deleted articles.
Field | Description |
|---|---|
Total articles | Total number of unique articles that were published in the date range based on the applied filters. The deleted articles are not considered. |
Total views | The number of times an article is accessed is counted once per browser session.
|
Total reads | An article read is recorded when a user engages through clicking, scrolling, and spending time on the page. The user has to perform all these three actions to count as one read.
Reads reflect meaningful interaction, distinguishing them from simple page loads. |
Total likes | The total number of likes an article has received. |
Total dislikes | The total number of dislikes received. |
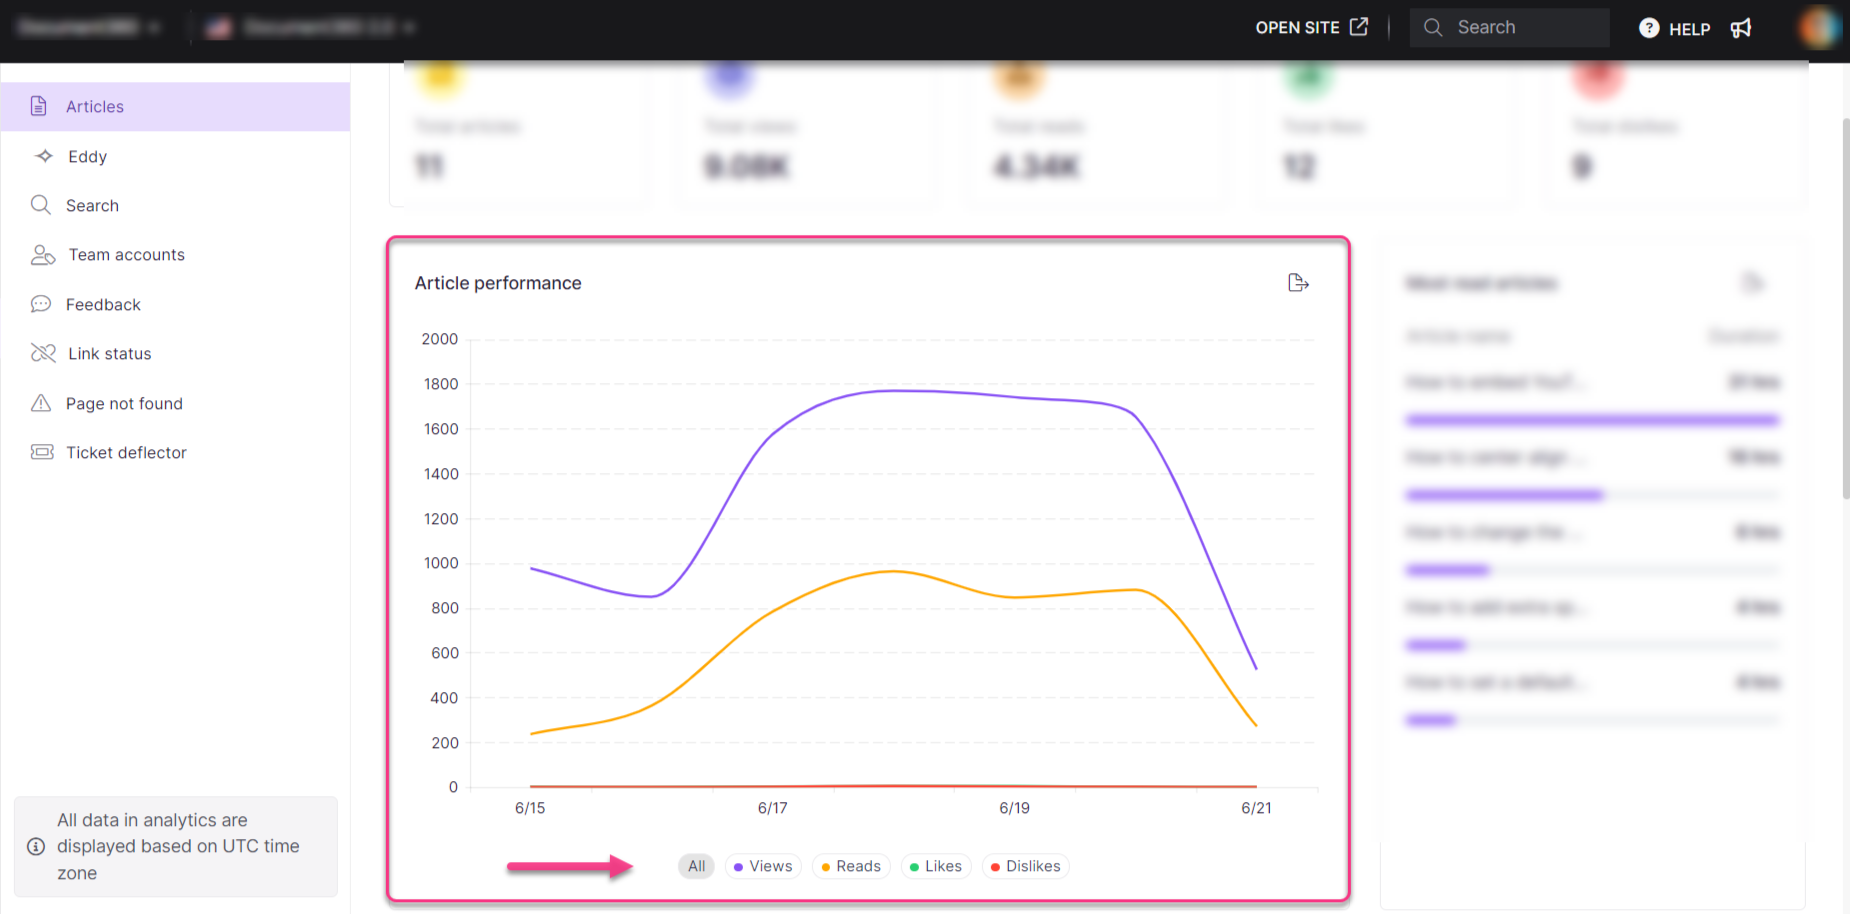
The aggregated data for Views, Reads, Likes, and Dislikes within the selected date range is presented in both a numeric format and graphs. You can interact with the graphs by clicking on the legends at the bottom to view individual data points. Click Export image ( ) to save the section as a PNG image.
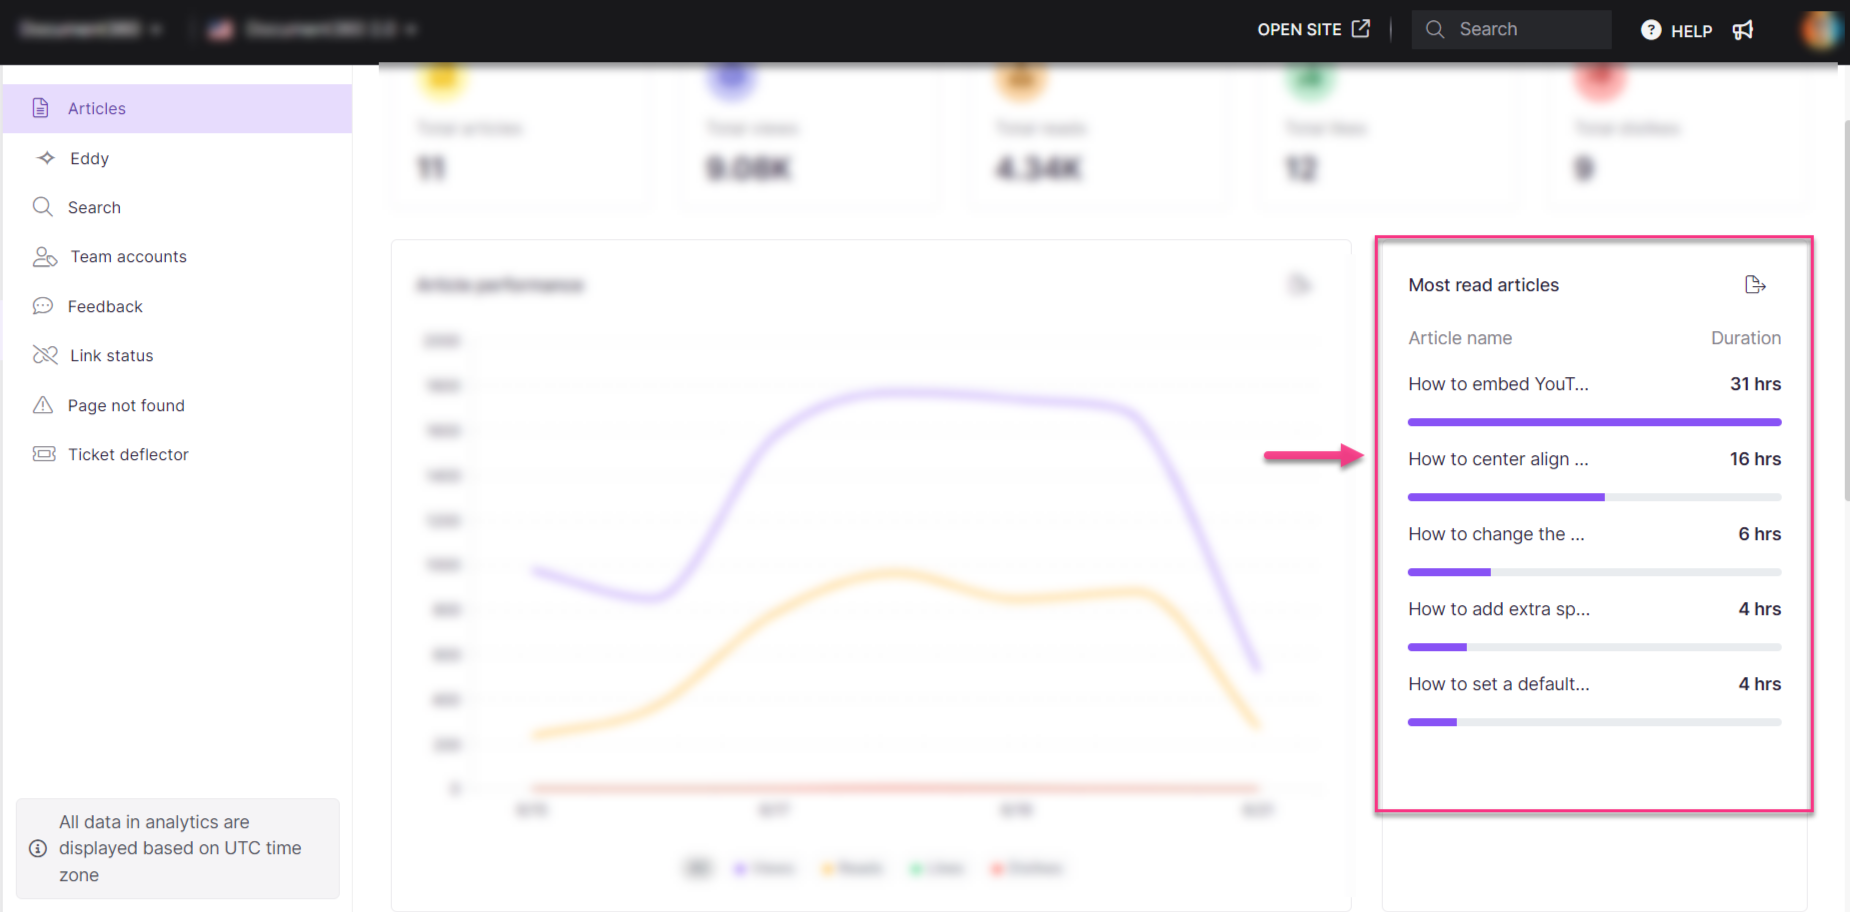
Most read articles
This section displays the top-performing articles based on total read time (in hours or minutes). The Article names are listed on the left, and the Duration is displayed on the right. Click on the Export image () icon to save the section as a PNG image.
Top articles list
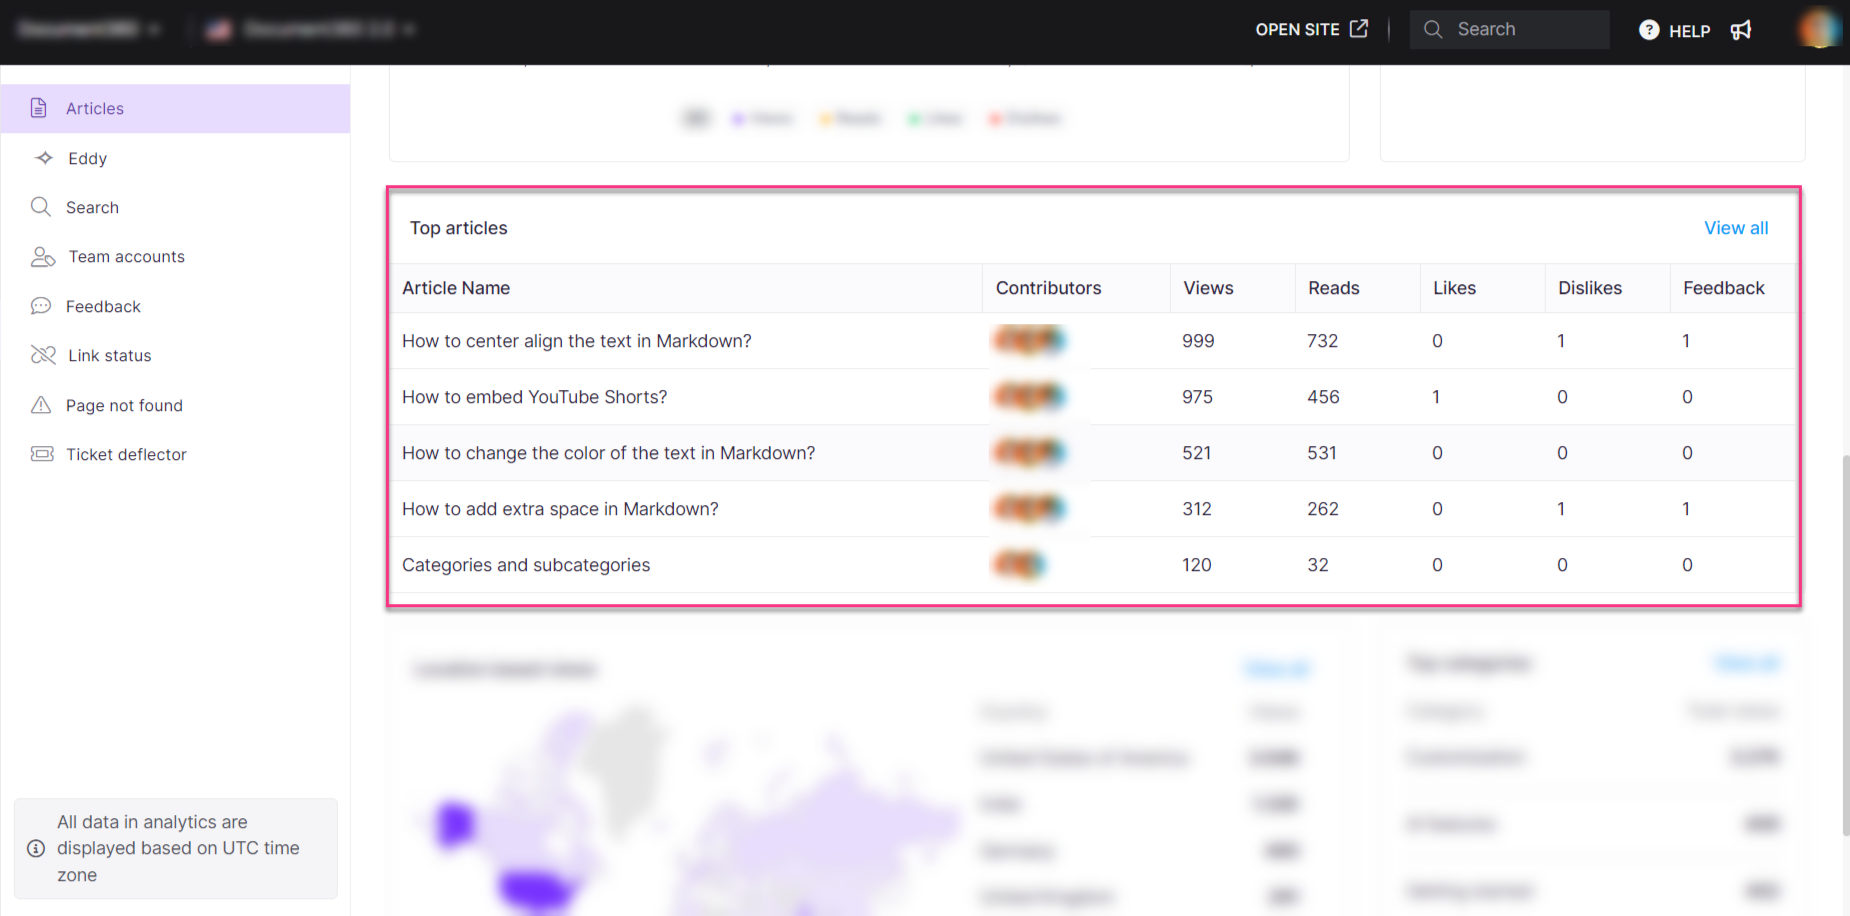
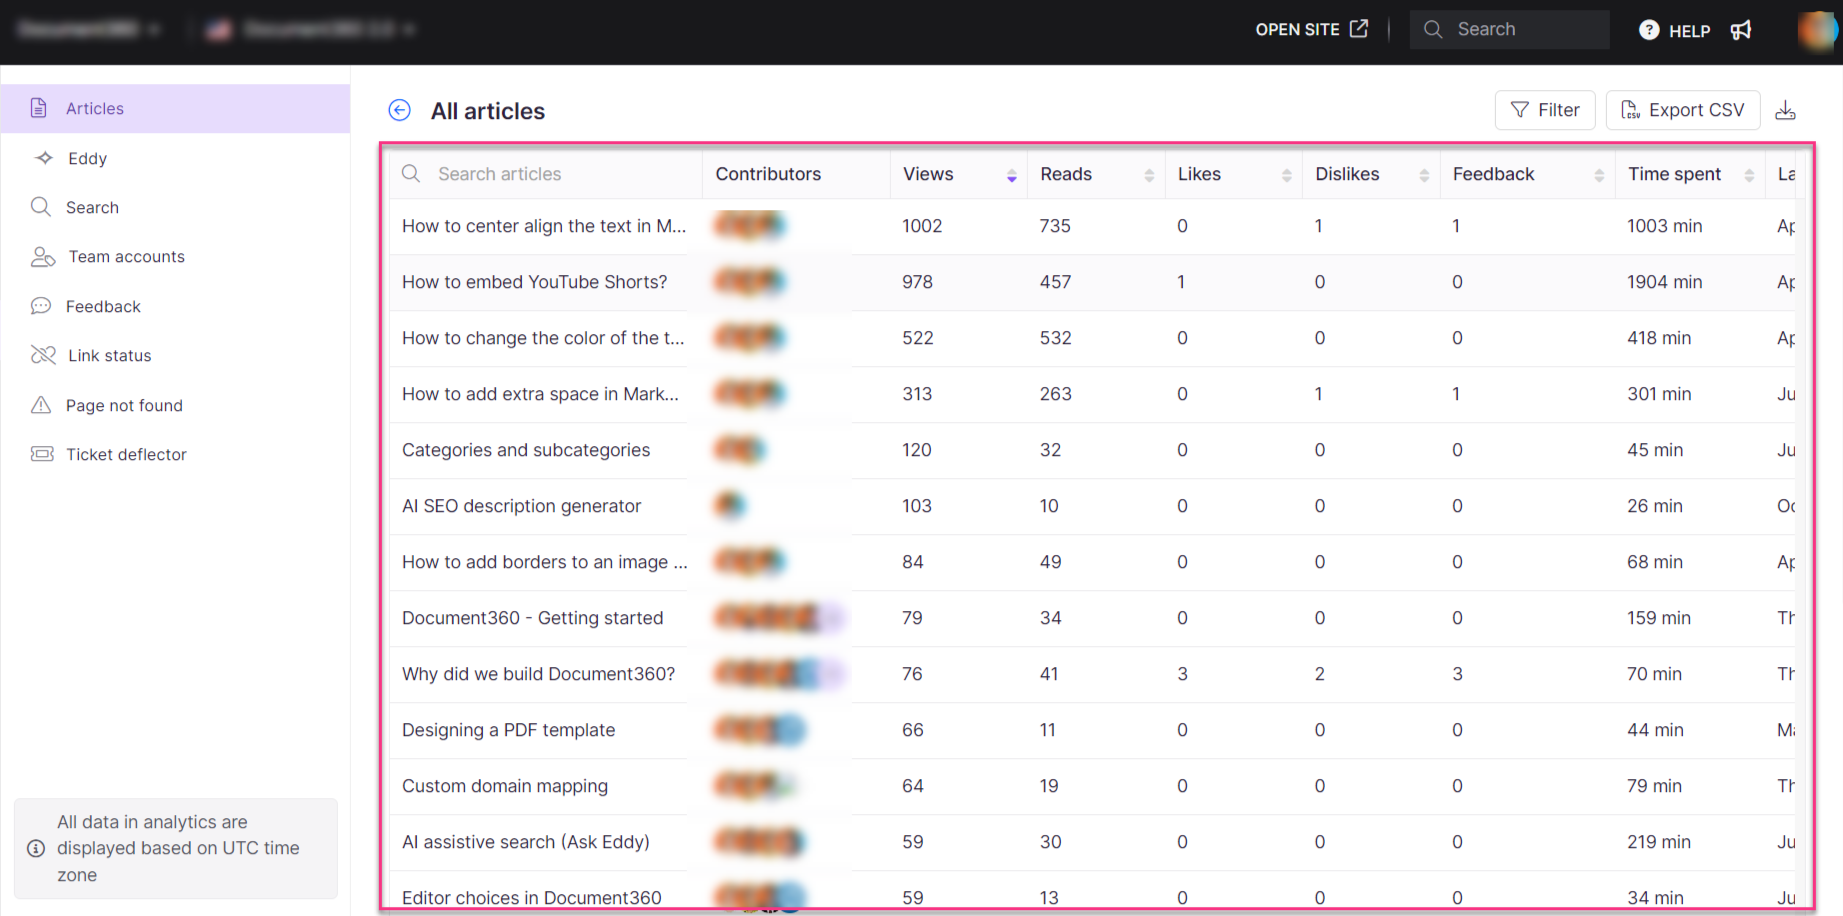
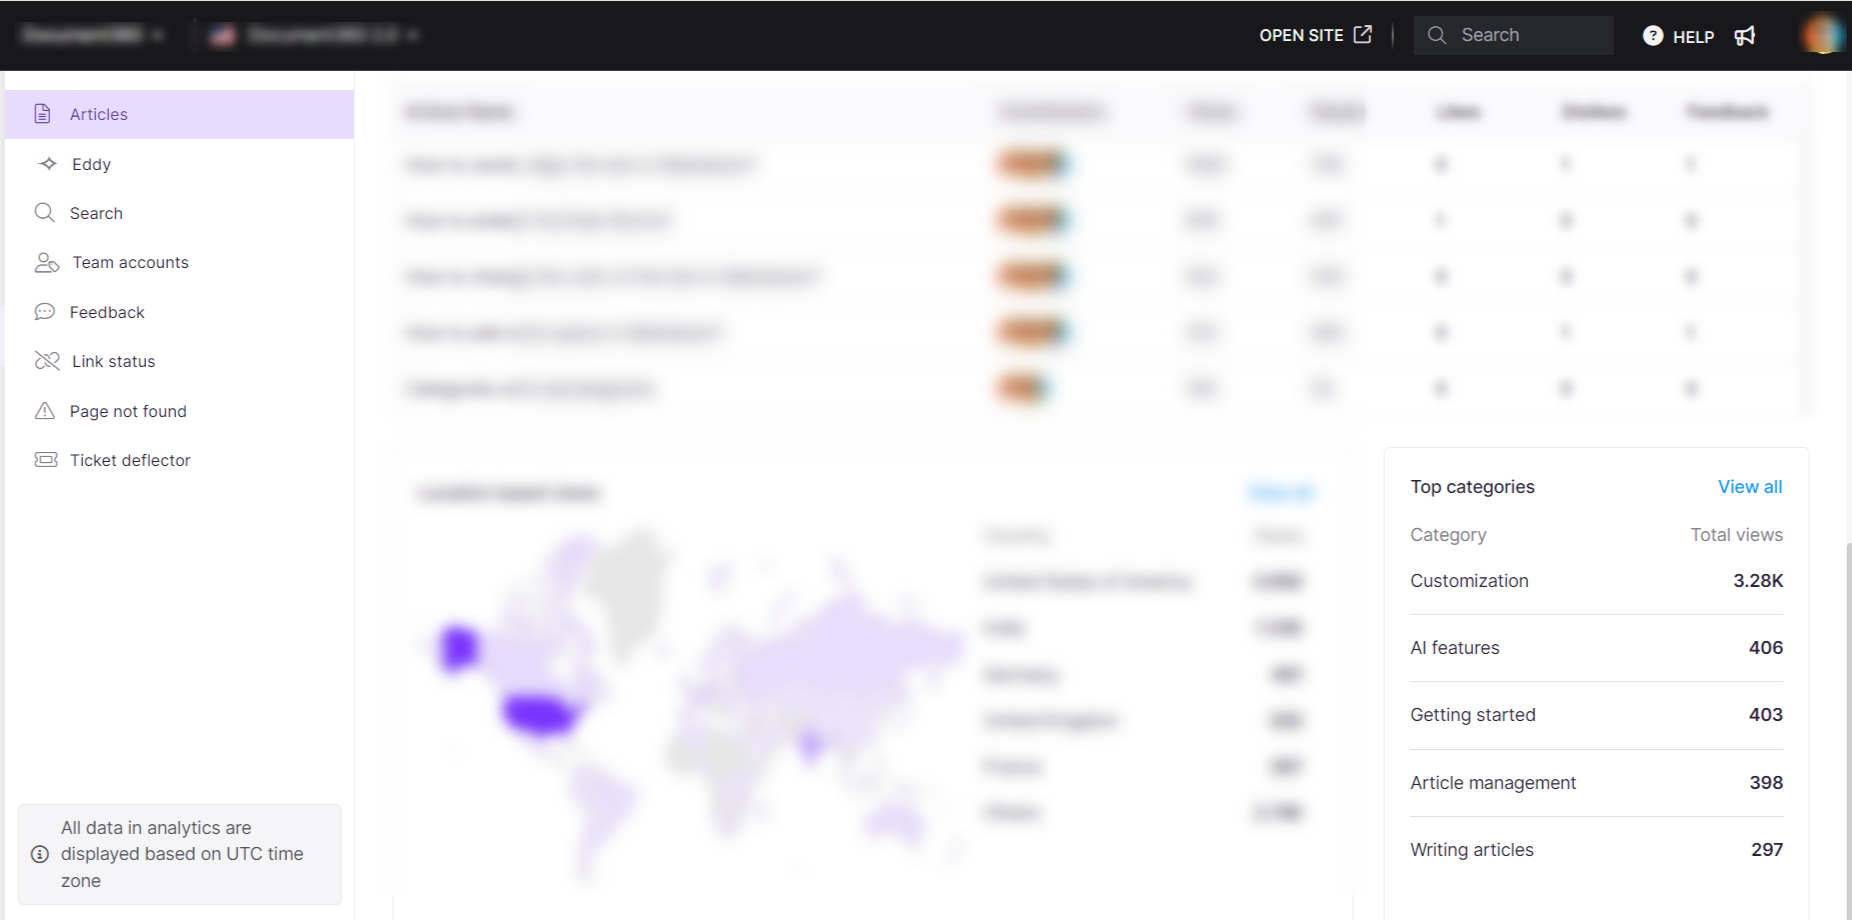
The top five articles are listed with information such as Article names, Contributors, Views, Reads, Likes, Dislikes, and Feedback. These articles are ranked by views. Click View all to see all the articles in your knowledge base, along with additional information such as time spent and the last updated date. This list does not contain the deleted articles.
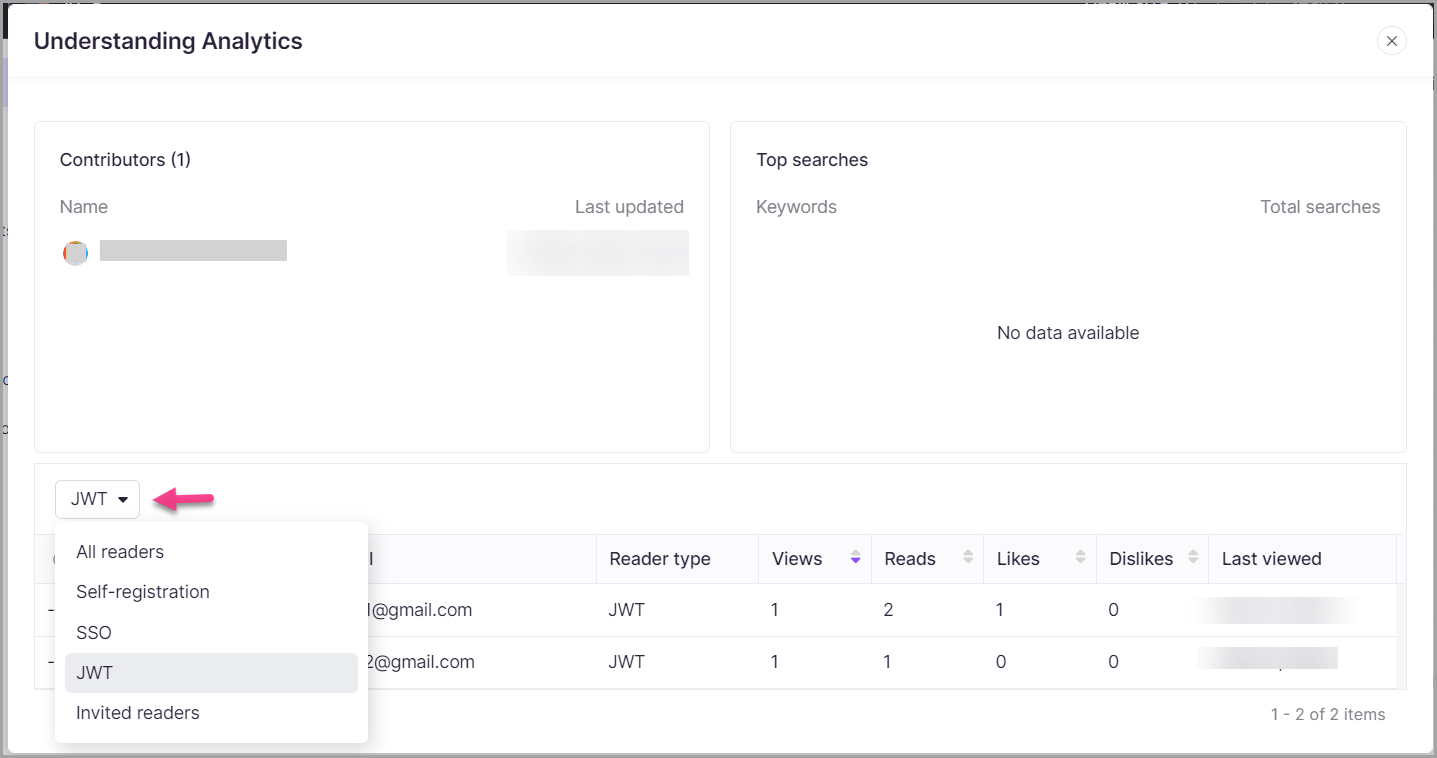
To analyze specific articles, select one from the list to view detailed analytics. Filters are available to sort readers by:
All readers
Self-registration
JWT
Invited readers
You can filter the following article type, contributors, and date.
Click Export CSV to export the articles in the list.
Click the Download () icon to download the last exported file.
Click on the back arrow on the top-left to navigate back to the Articles page.
Location-based views
This section displays a world map highlighting countries based on article views. The data is derived from the IP addresses of users who accessed the articles. A table beside the map lists the top 5 countries, showing the total number of views for each of them (here the cumulative views are shown including those that were garnered by deleted articles as well). These locations are ranked by views. The rest of the countries are grouped under Others.
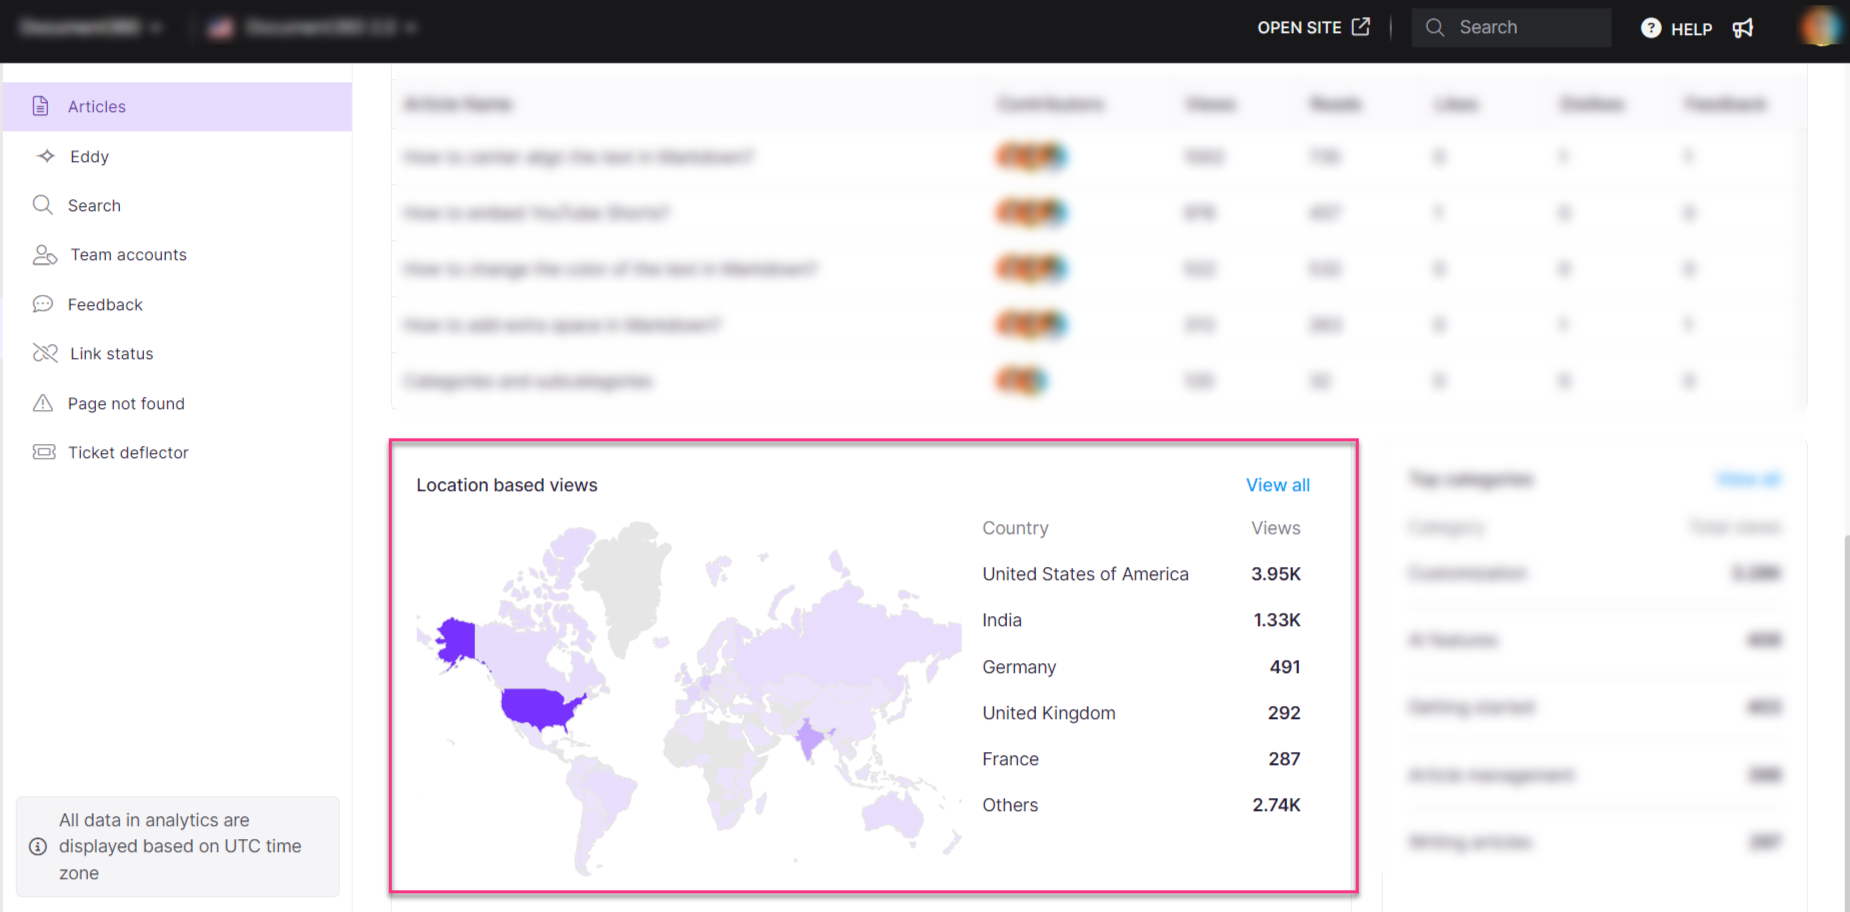
Click on View all to view detailed country-based information.
NOTE
The View all list has tiles representing the number of total views, reads, likes, and dislikes. This count, however, unlike the main page does not include the deleted articles.
All the countries with at least one view are available. Scroll to view the list of countries on the left side. You can also search for the countries by name.
The article names, views, reads, likes, dislikes, and average time spent are available as a list.
You can filter the location data based on article type and date.
Click on the Export CSV button to export the articles in the list.
Click Download () icon to download the last exported file.
Click the Close (X) icon on the top right to navigate back to the Articles page.
Top categories
This section displays the top category name and total views. These categories are ranked by views (here the cumulative views are shown including those that were garnered by deleted articles as well).
Click on View all to view the entire list of categories. The category name, number of articles in the category, views, reads, likes, dislikes, and time spent (in minutes) in the categories. This count, however, unlike the main page does not include the deleted articles.
You can filter the data based on the category type (All, Folder, Page, or Index).
Click on the Export CSV button to export the categories in the list.
Click the Download () icon to download the category list.
Click on the back arrow on the top-left to navigate back to the Articles page.
FAQs
Why do my most-read articles and top articles sections differ?
The Most read articles section lists the top 5 articles with the longest read times during the selected period. In contrast, the Top articles section lists the top 5 most viewed and read articles on your knowledge base, consolidated for the selected period.
Which team account roles in Document360 can access the Analytics section? Is it limited to Admins and Owners?
In Document360, Admins, Owners, and Contributors can access the Analytics section if their content role is Editor or draft writer.
If you want to restrict team accounts from accessing the Analytics section, you can create a custom portal and content role and uncheck the "Analytics" permission. This will prevent specific users from accessing Analytics.
When creating a new team account or modifying an existing one, assign this custom content role to ensure users with this role can't access the Analytics section.
For more details on creating a custom content role, read the Roles and permissions article.
How can I find the file size I am trying to export?
Currently, Document360 does not display the file size before export. After downloading the file, you can check the size on your local device.
How does the analytics track read counts for smaller articles that do not require scrolling?
For shorter articles where scrolling is not necessary, a read is counted if a user clicks on the article and spends at least 60 seconds engaging with the content. Even without scrolling, this interaction is recognized as a valid read based on the read time shown in the article.