The Eddy AI - Assistive Search analytics page gives you a complete picture of how readers interact with Eddy AI across your knowledge base, tracking conversations, query volumes, answered and unanswered searches, and reader feedback. Use this page to identify content gaps, measure AI search effectiveness, and take targeted actions to improve your documentation coverage.
To know more about the languages supported by Eddy AI, click here.
Advanced Eddy AI analytics adds unanswered query scope analysis, topic topics, taxonomy, content utilisation, and query type breakdowns. If the Try new Eddy AI analytics option is available for your project, read Advanced Eddy AI analytics. To check availability for your project, contact your Customer Success Manager or Document360 support.
Why use Eddy AI search analytics
Use the Eddy AI search analytics page when you want to:
- Identify unanswered queries — find topics your readers search for but cannot find answers to, signalling content gaps.
- Monitor AI search performance — track answered vs. unanswered query trends over time to assess how well Eddy AI serves your readers.
- Audit reader feedback — review likes, dislikes, and feedback comments to evaluate the quality and relevance of AI-generated responses.
- Investigate individual conversations — drill into specific user interactions to validate citation accuracy and response quality.
Before you begin
You must have admin, owner, or custom access to the Knowledge base portal.
Access Eddy AI search analytics
- Navigate to Analytics () in the left navigation bar in the Knowledge base portal.
- In the left navigation pane, click Eddy AI. The Eddy AI - Assistive Search page appears.
- By default, data for the current month is displayed.
.png)
Click Try new Eddy AI analytics to access the new advanced Eddy AI analytics.
Using filters to customize the data
By default, the page shows metrics for the current month. To adjust the timeframe or scope:
- Click the Month filter dropdown.
- Choose a predefined range (This month, Last month) or select Custom to specify a particular month. When using the Custom filter, you can select only the month from the calendar.
- Click Filter to narrow results by application type: All, Knowledge base site, Knowledge base widgets, Chatbot, Public API, or extensions such as Freshdesk or Zendesk.
Understanding the analytics page
Metric tiles
The top of the page displays the following performance metrics as tiles:
| Field | Description |
|---|---|
| Total conversations | Total number of conversations in Eddy AI, where one or more queries count as a conversation. Available only in KB site 2.0. A single message is also counted as a conversation. |
| Total queries | Total count of individual questions asked to Eddy AI. Queries are individual questions within a conversation. |
| Answered queries | Total number of queries that returned a result. |
| Unanswered queries | Total number of queries that did not produce any results. |
| Total likes | Total number of likes received on search responses, indicating a satisfactory answer. |
| Total dislikes | Total number of dislikes received, indicating an unsatisfactory response. Dislike reasons include: difficult to understand, inaccurate or irrelevant content, incorrect sources/references/citations, missing information, don't like the style, and others (with a free-text comment). |
| Total feedback | Total number of feedback comments received for AI assistive search responses. |
If multiple chatbots are deployed, data from all chatbot instances is merged into a single result set. Similarly, data from all knowledge base widget instances is combined.
Query analysis
The Query analysis graph lets you explore query performance over time. You can interact with it using the tabs along the top:
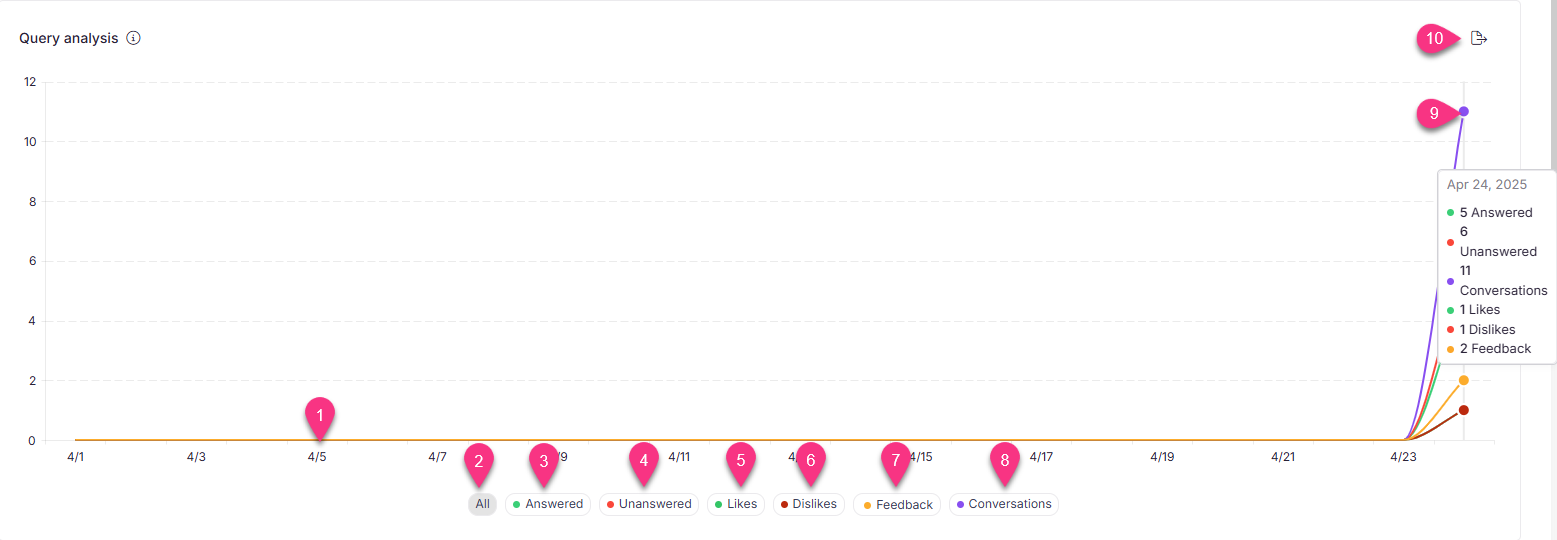
- The horizontal axis displays dates based on the selected Month filter.
- All — view the comparison of answered queries, unanswered queries, and conversations in a single graph.
- Answered — view queries that returned a result.
- Unanswered — view queries that did not produce any result.
- Likes — view likes received on search responses.
- Dislikes — view dislikes received on search responses.
- Feedback — view feedback comments received for search responses.
- Conversations — view conversation trends. Available only for KB site 2.0 projects.
- Hover over the graph to see metrics for a specific date.
- Export image — download the Query analysis graph as a .png file.
Keep Unanswered searches as low as possible relative to Answered searches. Unanswered searches typically occur when relevant information is missing from your documentation. Keeping content up to date helps reduce these instances.
Conversation depth metrics
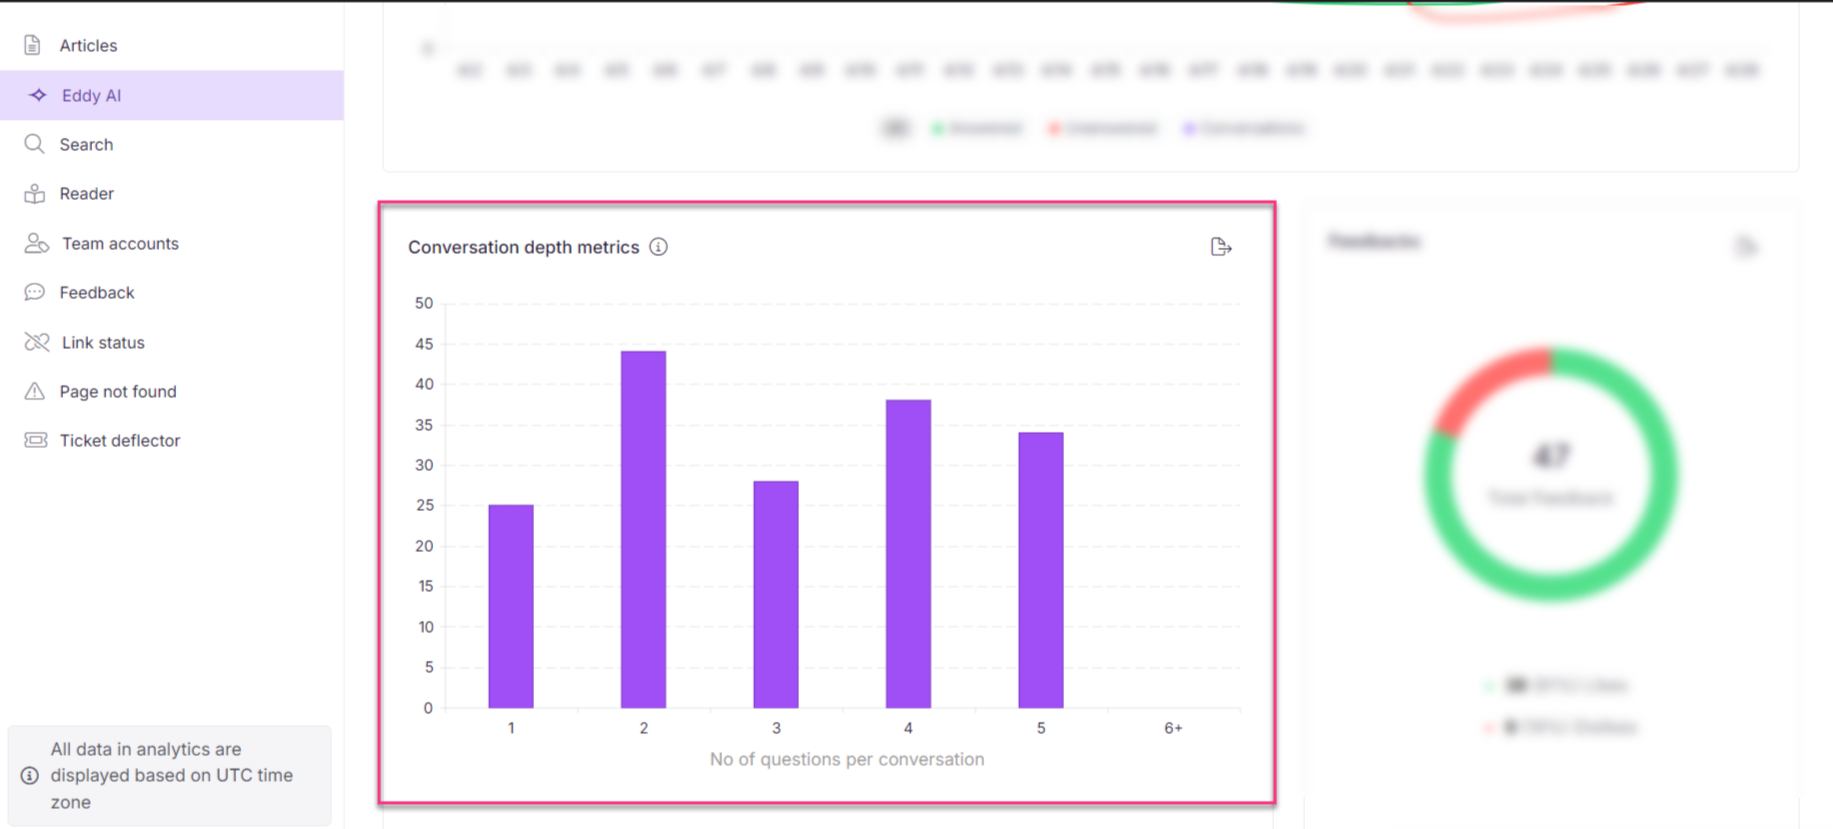
The Conversation depth metrics graph is available only for KB site 2.0 projects. It shows the distribution of queries per conversation alongside the total number of conversations.
- Hover over each bar to see the exact conversation count. The graph tracks conversations from 1 to 5 queries, with anything beyond 5 queries grouped as 6+.
- Click the Export image () icon to download the graph as a .png file.
Feedback chart
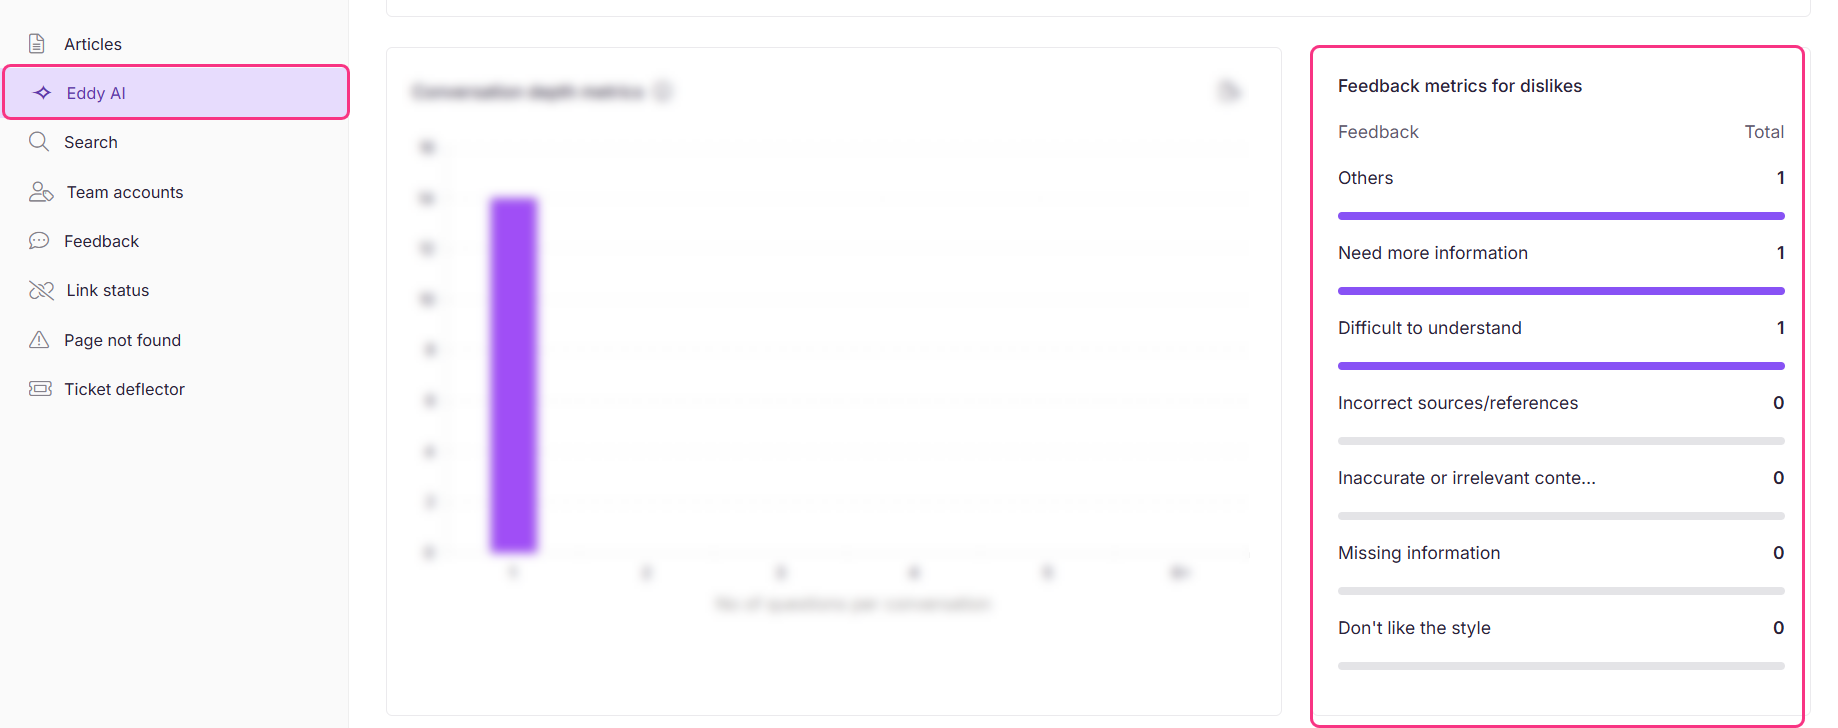
The Feedback chart displays the breakdown of dislikes by reason, along with counts for each category. Use this chart to identify which aspects of Eddy AI responses readers find most unsatisfactory.
Popular queries
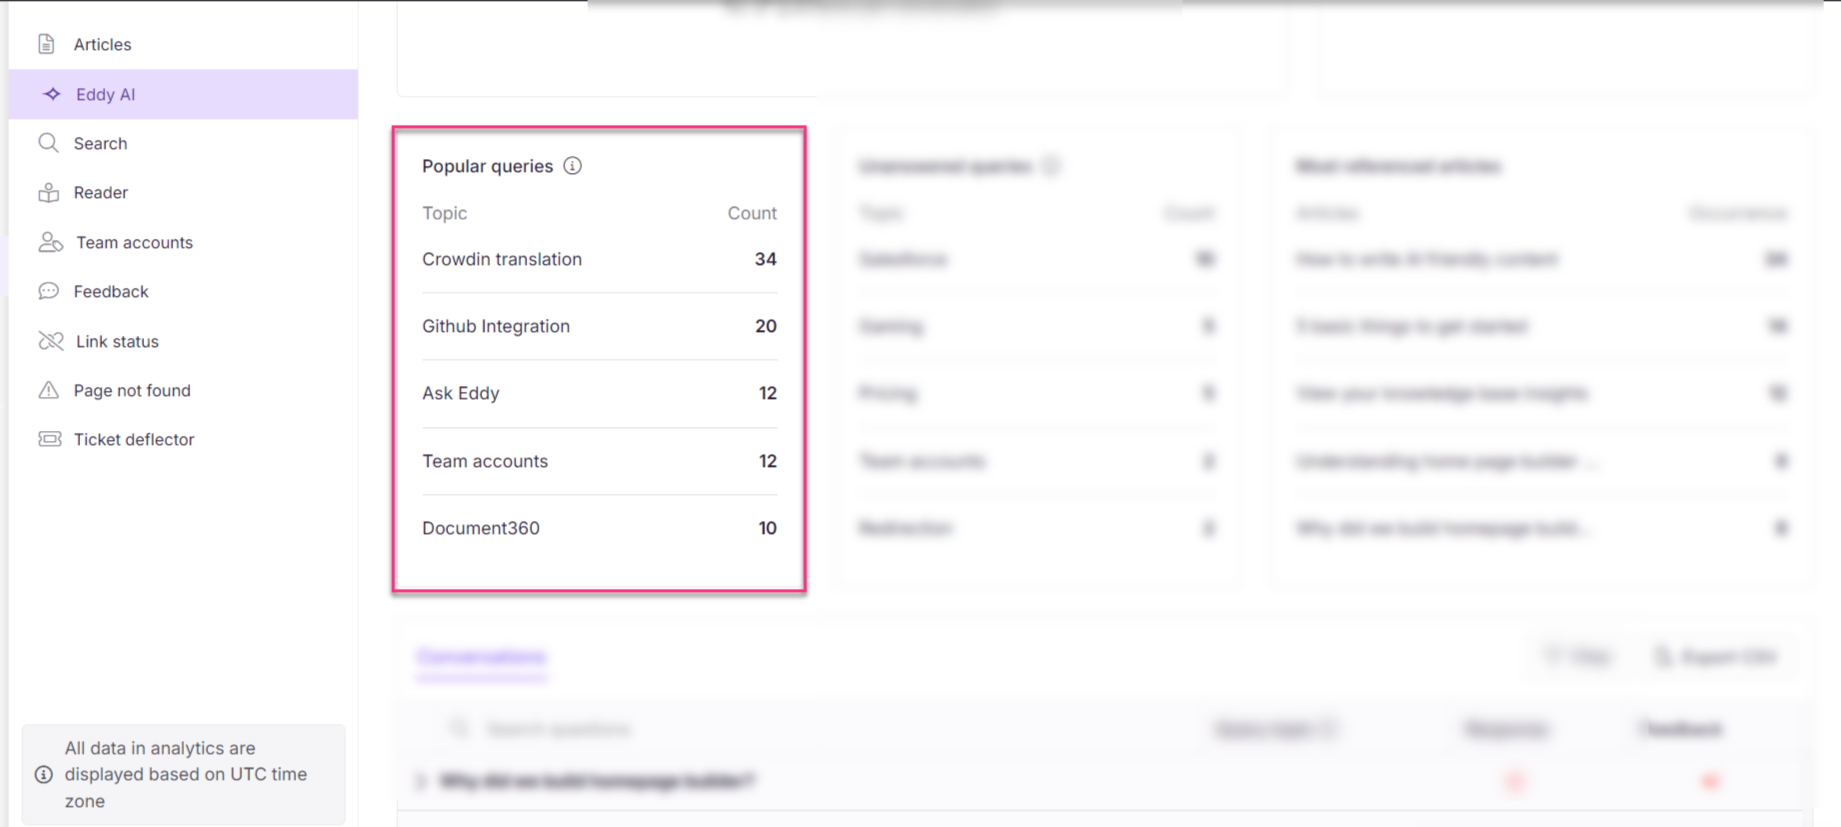
This section shows the top five search themes for the selected month, grouped by keywords. It highlights the topics readers search for most frequently and how often each theme appears.
Popular queries are generated only when at least one full month of data is available.
Unanswered queries
This section shows the top five search themes for the selected month where Eddy AI could not return a result. These themes highlight the most common content gaps in your knowledge base.
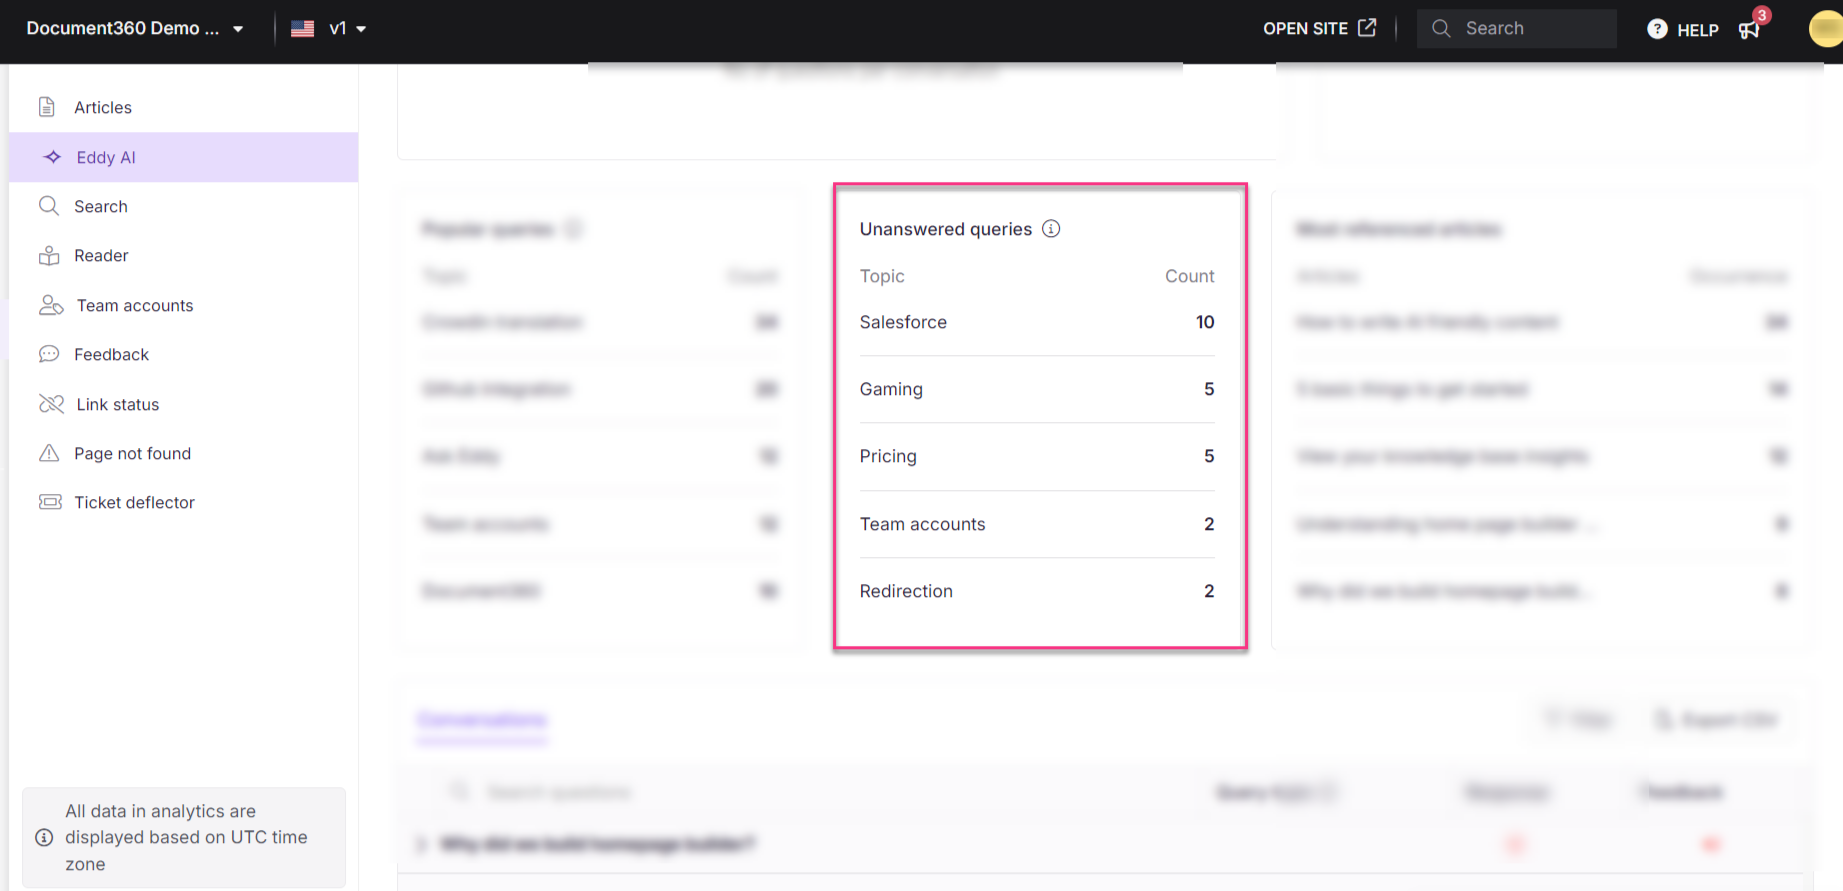
Query post-processing runs monthly across 30 days of data. The data is sent to OpenAI, which identifies the most common keywords and groups them into up to 10 primary topics. Queries that do not fit a topic are grouped under "Others."
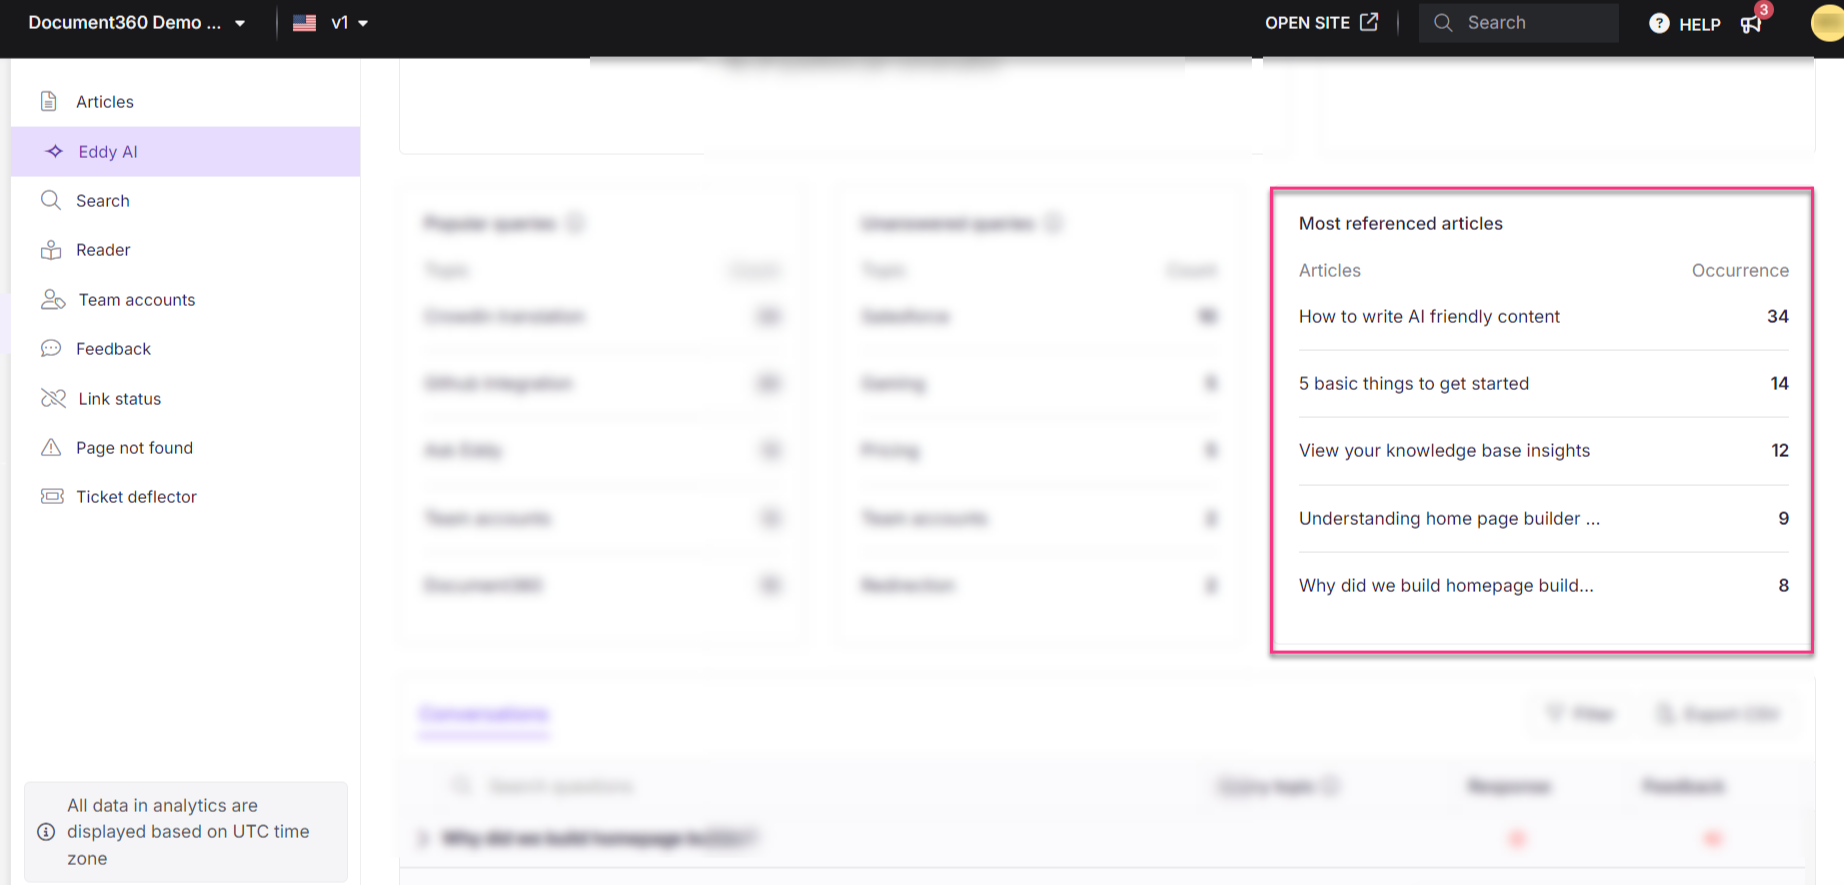
Most referenced articles
This section lists the five articles most frequently cited by Eddy AI in search results for the selected month, along with the citation count for each.
Hover over an article title and click View in Knowledge base () to open the article in the Knowledge base site.
Conversations
The Conversations section provides a detailed, tabular view of every user interaction — including the full query, response status, and any feedback received.
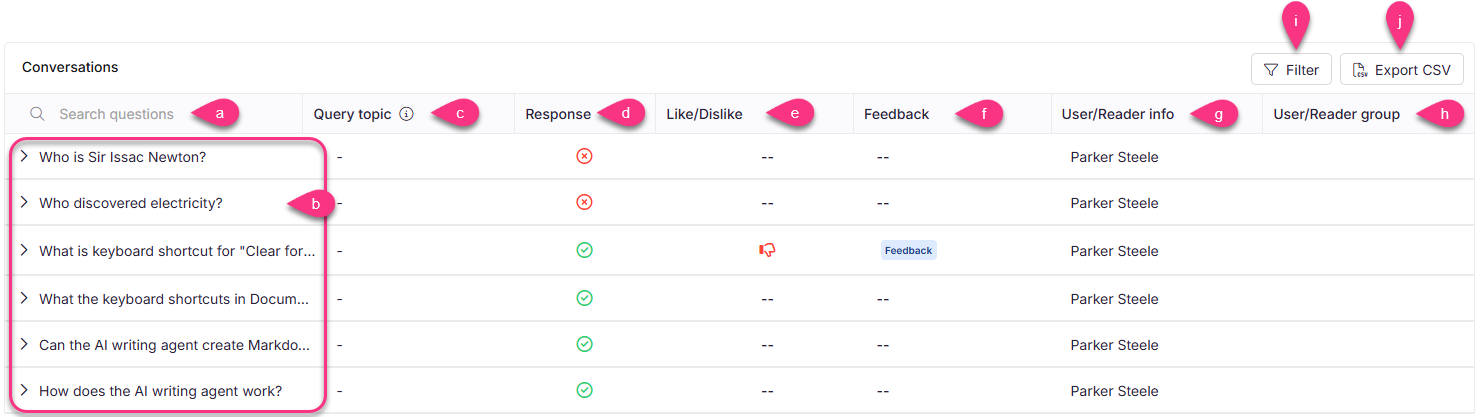
The table includes the following columns and controls:
a. Search field — enter a keyword or phrase to find a specific conversation or question.
b. Conversations — displays the first question of each conversation; subsequent questions are collapsed by default. Expand a row to view all questions, or click a query to open a side panel showing the full conversation, user information (if available), user group, and the date and time of the interaction.
If a conversation started in a previous month and continues into the current month, it is attributed to the month in which it started.
c. Query topic — topics are assigned from the popular queries list. At least 30 days of data is required to generate a query topic. Only the top 5 popular topics are displayed.
d. Response — indicates whether the query was answered () or unanswered ().
e. Feedback icon — shows whether feedback was a like () or dislike ().
f. Feedback — displays a Feedback tag if the query received feedback. Click to navigate to the Eddy AI feedback manager to view the full feedback details.
g. User info — for Mixed and Private projects, displays the name or email address of the user who submitted the query (when available). For JWT users without a name, the associated email address is shown if available. This identity is analytics metadata held within Document360; it is not sent to OpenAI as part of the query or response. See Data privacy and security in the Ask Eddy AI article for what is sent to OpenAI.
h. User group — displays the reader group or user group associated with the user, if applicable.
i. Filter — filter conversations by:
- Response status: All, Answered, or Unanswered.
- Feedback: All, None, Like, or Dislike. This covers feedback received on Eddy AI responses from the Knowledge base site, Widget, Chatbot, and Public API.
- Query topic: Filters queries from previous months (unavailable for the current month). Options include Select all (displays both five popular queries and five unanswered queries), Popular queries, and Unanswered queries.
j. Export CSV — download the filtered conversation data as a .csv file. Click the Download () icon to retrieve the last set of files exported.
When the Anonymize reader information setting is enabled, reader-identifiable information linked to Eddy AI conversations is anonymised. User names, email addresses, and reader IDs will not appear in analytics or exports.
Viewing Eddy AI source articles
When you expand a query in the Conversations section, the response displays numbered citations (e.g., 1 2 3) at the end. Hovering over a citation number reveals the article title; clicking it opens the source article in the Knowledge base site.
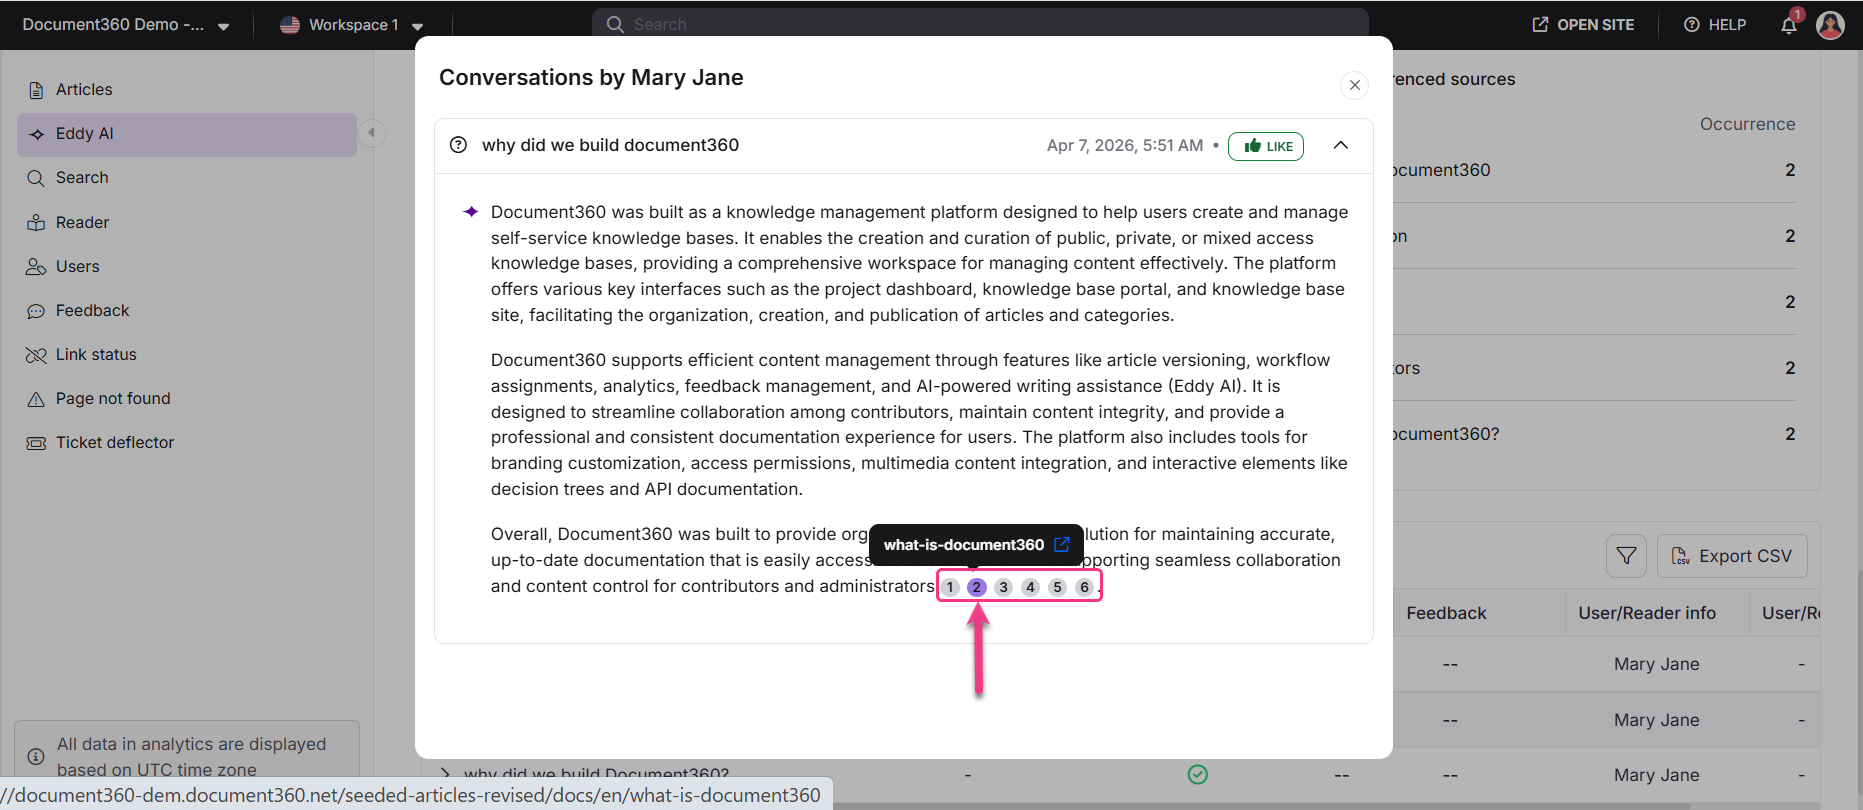
This lets you quickly validate the sources Eddy AI used to generate a response and identify content that may need to be updated. Citation links always point to the latest published version of the source article. If the article has since been deleted, the link will display an Error 404 page.
Citation details are not available in OpenAPI or API documentation. They are only accessible from the Knowledge base portal or the Knowledge base site.
Advanced Eddy AI analytics
Advanced Eddy AI analytics extends the Eddy AI analytics experience with deeper breakdowns of how readers use Eddy AI and where it falls short. Alongside query volumes and feedback, it groups queries into topics, classifies unanswered queries by whether your documentation was expected to cover them, and shows how much of your content Eddy AI draws on when generating responses.
Advanced Eddy AI analytics is available for select plans and must be enabled for your project. If you do not see the Try new Eddy AI analytics option on the Eddy AI - Assistive Search analytics page, contact your Customer Success Manager or Document360 support to check availability for your project.
What you can analyze
Use advanced Eddy AI analytics to answer questions such as:
- Of the queries Eddy AI could not answer, how many were in scope, meaning questions your documentation was expected to cover?
- Which topics are readers asking about most, and which of those topics are failing?
- What types of messages do readers send: questions, statements, troubleshooting requests, or commands?
- How much of your published content does Eddy AI actually draw on, and which articles does it cite most often?
Open the advanced analytics page
- Navigate to Analytics () > Eddy AI in the Knowledge base portal.
- Click Try new Eddy AI analytics. The advanced analytics page appears, with three tabs: Query analysis, Content utilization, and User interaction.
- By default, data for Last month is displayed. Use the month picker in the page header to select a different calendar month.
.png)
Open the advanced analytics page from the Try new Eddy AI analytics option each time. Select Switch back to the classic analytics.
Query analysis
The Query analysis tab shows how many queries Eddy AI answered, how many it did not, and what readers were asking about.
Metric tiles
The top of the tab displays the following metrics as tiles. Each tile also displays the change compared to the previous month and a trend indicator.
| Field | Description |
|---|---|
| Total queries | Total count of individual questions asked to Eddy AI. Queries are individual questions within a conversation. |
| Answered queries | Total number of queries that returned a result. |
| Unanswered queries | Total number of queries that did not produce any result. |
| Total conversations | Total number of conversations in Eddy AI, where one or more queries count as a conversation. |
Unanswered query breakdown
Unanswered queries are classified by whether your documentation was expected to answer them. Click View details to expand the breakdown.
| Field | Description |
|---|---|
| In scope | Queries about topics your documentation is expected to cover. Prioritise these when addressing content gaps. |
| Out of scope | Queries about topics outside the scope of your knowledge base. |
| Scope unclear | Queries that could not be confidently classified as in scope or out of scope. |

Query trend
The Query trend chart plots four series day by day across the month: queries, answered queries, unanswered queries, and conversations.
.png)
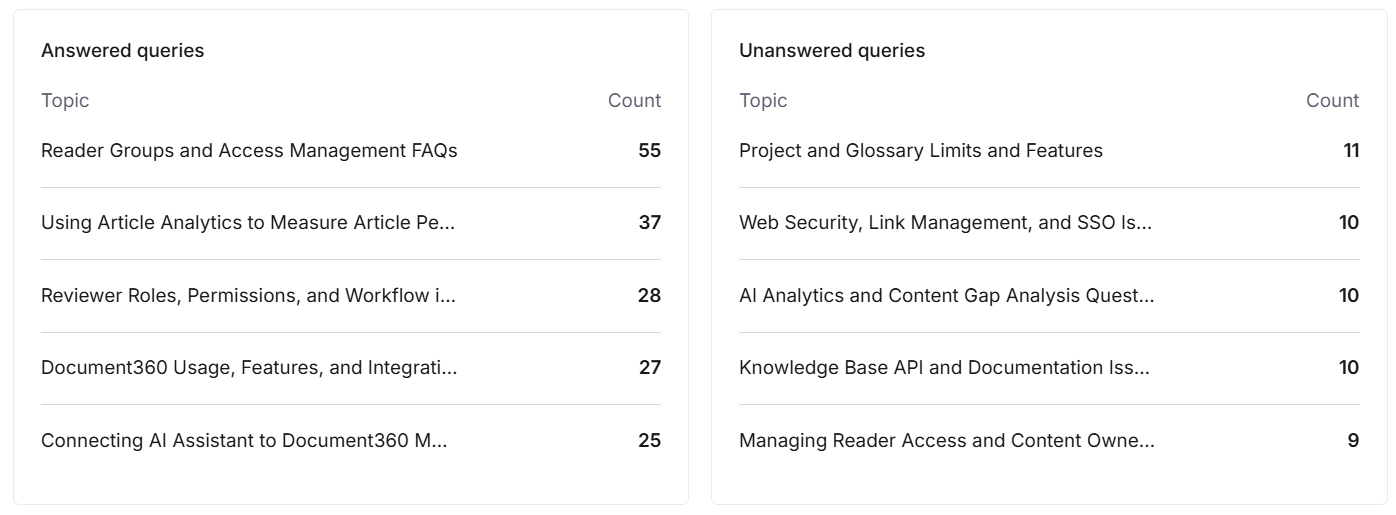
Topic cards
| Field | Description |
|---|---|
| Answered queries | The topics with the highest number of answered queries, with a count for each. |
| Unanswered queries | The topics with the highest number of in-scope unanswered queries, with a count for each. These are your clearest content gaps. |
Conversations
The Conversations section lists individual queries across three sub-tabs, each grouping them differently.
| Sub-tab | Description |
|---|---|
| All queries | Every query, with its response status and any likes or dislikes received. Use the Filters option to filter by response status (All, Answered, Unanswered) and feedback (All, Liked, Disliked, No feedback). |
| Topics | Queries grouped into topics, groups of related questions that share a common topic. Each row displays the cluster name, whether the cluster was answered or unanswered, and the number of questions it contains. Expand a row to view the individual questions, and click Show more to view beyond the first five. Use the All topics dropdown to filter by All topics, Answered, In scope, or Out of scope. |
| Taxonomy | Topics grouped into a taxonomy, a broader subject area that contains multiple topics. Each row displays the taxonomy name, the number of topics, and the number of questions. Click View to open a list of the topics within that taxonomy and their question counts. |
.png)
Content utilization
The Content utilization tab shows how much of your knowledge base Eddy AI uses when generating responses.
| Field | Description |
|---|---|
| Content used by Eddy AI | The percentage of your published content that Eddy AI used when generating responses. |
| Article cited by Eddy AI | The number of articles Eddy AI cited in its responses. |
| Articles read by Eddy AI | The number of articles Eddy AI referred to while generating responses. |
| Content utilisation rate | A chart showing the cumulative percentage of content used across the month. |
| Eddy AI content usage | A table listing each article, the number of times Eddy AI used it (Occurrence), and its Occurrence rate in percentage. The table displays up to 20 articles. |
Use this tab to identify the articles carrying the most weight in Eddy AI responses, and to spot content that Eddy AI never draws on.
.png)
User interaction
The User interaction tab shows what kind of messages readers send to Eddy AI and how they rate the responses.
| Field | Description |
|---|---|
| Total queries | Total count of individual questions asked to Eddy AI. |
| Total likes | Total number of likes received on Eddy AI responses. |
| Total dislikes | Total number of dislikes received on Eddy AI responses. |
| Query type distribution | A chart showing how queries are distributed across four message types. Click a query type to filter the Queries table. |
| Queries | A table listing the individual queries for the selected message type. The heading displays the query type and its total count. |
Queries are classified into the following message types:
| Message type | Description |
|---|---|
| Questions | Messages phrased as a direct question, such as "How do I publish an article?" |
| Statements | Messages phrased as a statement rather than a question, such as "The publish button is missing." |
| Troubleshooting | Messages reporting a problem or asking how to resolve an error. |
| Commands | Messages phrased as an instruction, such as "Show me the API reference." |
.png)
Filters and navigation
- Month — data is shown for one whole calendar month at a time. Changing the month refreshes every panel on the page.
- Workspace version and language — data is scoped to the workspace version and language selected in the top bar. Switching either one refreshes every panel on the page.
- Pagination — the tables display 10 rows per page. Changing the month, version, language, or a filter returns each table to the first page.
Things to know
- All data on this page is displayed in UTC, not your local time zone.
- Data is available for whole calendar months only. Weekly and custom date ranges are not supported.
- Advanced analytics data is processed monthly. If processing for the selected month is not yet complete, the panels display 0 and No data available.
- The tiles and charts refresh periodically, so they can briefly show lower values than the tables below them. If this happens, check again later in the day.
- Exporting charts and tables from the advanced analytics page is not available yet. To export conversation data, use Export CSV on the Eddy AI - Assistive Search analytics page.
- A newly created or copied project has no advanced analytics data until the first monthly processing completes for that project.
Understanding AI credit usage and analytics
In some cases, the query count shown in Eddy AI search analytics may differ from the usage credits consumed under the Eddy AI feature. This can happen for two reasons:
- Multi-language projects - if your project supports multiple languages (for example, English and German), credits are consumed across all languages. However, the Analytics view for a single language shows only queries made in that language, which may appear lower than total credit usage.
- Non-chargeable interactions - simple greetings such as "Hi" or "Hello" are recorded in Analytics for completeness but do not consume credits. As a result, the query count in Analytics can be slightly higher than the number of credits used.
If you reach the usage limit, contact support to update or verify your detailed usage data.
Best practices
- Review unanswered queries monthly - use the Unanswered queries section to identify recurring content gaps and update or create articles to address them.
- Act on dislike feedback - check the Feedback chart regularly. Responses marked as "inaccurate" or "missing information" are the highest-signal items to investigate.
- Cross-reference most-referenced articles - these articles carry the highest weight in Eddy AI responses. Ensure they are accurate, up to date, and comprehensive.
- Use the Conversations table to validate citations - expand individual queries to confirm that source articles are correct and current. Deleted source articles result in broken citation links.
- Start with in-scope unanswered queries - if advanced Eddy AI analytics is available for your project, work through the in-scope unanswered topics first. These represent questions your documentation was expected to answer.
FAQ
Why am I unable to filter the data on a weekly basis?
Popular queries and unanswered search keywords are derived from algorithmic grouping methods that require at least 30 days of data to categorise keywords based on response frequency. Weekly filtering is not supported because the dataset is too small for accurate grouping.
How do I resolve queries for which no response is generated?
Review the keywords listed in the Unanswered queries section. Use those keywords to identify relevant articles and update or create content that directly addresses the topic. You can also use the Eddy AI feedback manager to track unanswered query feedback to resolution.
How does Eddy AI conversation analytics work when a conversation spans multiple languages?
The conversation is recorded in the conversations table for each language used. However, specific metrics such as total searches, answered queries, unanswered queries, and feedback are only updated for the language in which each interaction occurred.
How does Eddy AI conversation analytics work when a conversation spans multiple workspaces?
The conversation is recorded in the conversations table for each workspace used. Specific metrics such as total searches, answered queries, unanswered queries, and feedback are only updated for the languages used within the respective workspace.
How are queries different from conversations?
A query is an individual question asked to Eddy AI. A conversation is a session that contains one or more queries. For example, a reader asking three follow-up questions in a single session counts as one conversation with three queries.
Why don't I see the Try new Eddy AI analytics option?
Availability depends on your plan, and the feature must be enabled for your project. Also confirm that you have analytics access — you need admin or owner access, or a custom role with view analytics permission. To check availability for your project, contact your Customer Success Manager or Document360 support.
Why do the tiles on the advanced analytics page show 0 when the tables below show data?
The tiles and charts on the advanced analytics page refresh periodically, while the tables read the latest processed data. If the tiles show 0 and the tables show results, the tile values have not refreshed yet. Check again later in the day.
Can I open the advanced analytics page directly using its URL?
No. Open the advanced analytics page from the Try new Eddy AI analytics option on the Eddy AI - Assistive Search analytics page each time. Entering the URL directly or refreshing the page in your browser returns you to the Eddy AI - Assistive Search analytics page.