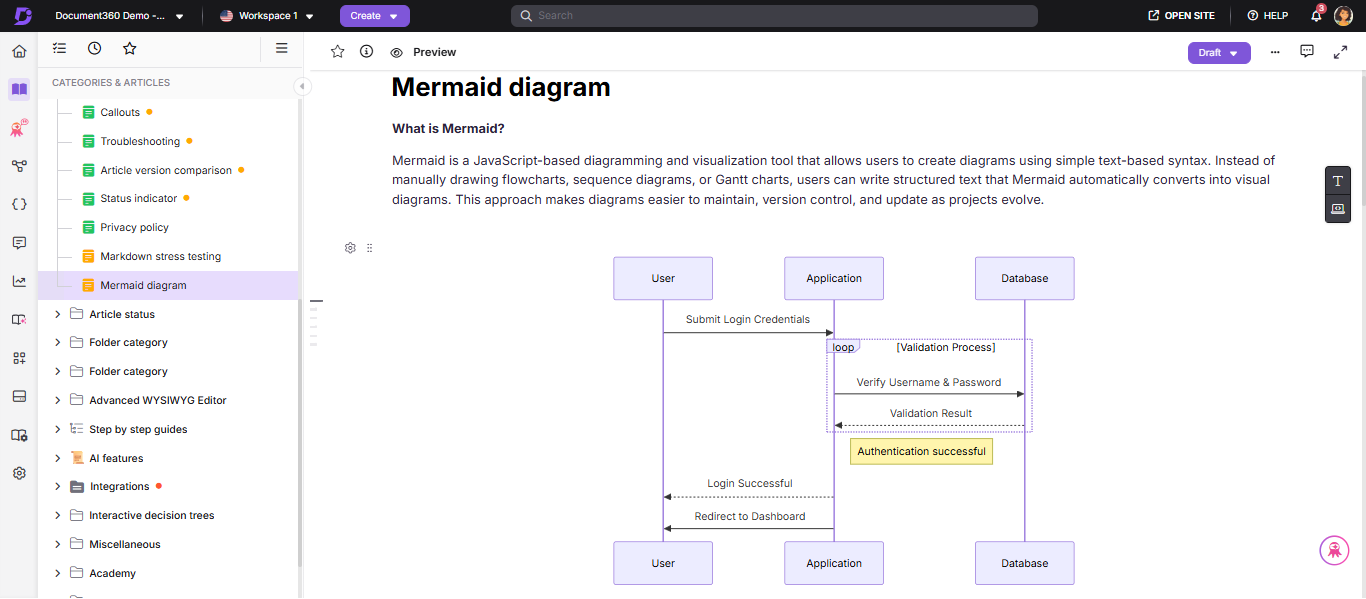
The Mermaid diagram brings native diagram creation directly into the editor. Powered by Mermaid.js, it lets you write text-based diagram syntax and see a rendered, visual diagram in real time - all without leaving your documentation workspace. Diagrams are stored as editable source code alongside a rendered image. This means your diagrams are always re-editable and never become stale static screenshots.
What is Mermaid.js?
Mermaid.js is an open-source diagramming library that converts plain text syntax into visual diagrams. Instead of drawing shapes manually in a separate tool, you describe the diagram in text and Mermaid renders it. Document360 embeds Mermaid.js directly in the editor, so the entire workflow happens without leaving your article.
Example: The following four lines of text produce a complete flowchart:
graph TD
  A[User submits ticket] --> B{Priority?}
  B -- High --> C[Notify on-call team]
  B -- Low  --> D[Add to backlog]
When to use Mermaid diagrams
Use Mermaid diagrams when your content involves a process, relationship, or structure that is harder to explain in words alone. Some common scenarios:
- A technical writer documenting an approval flow or onboarding journey
- A developer or architect illustrating an API interaction, system architecture, or database schema
- A product manager mapping a user journey or visualizing a project timeline
- A support team building a troubleshooting flowchart or escalation path
If you find yourself describing a sequence of steps or connections between components across multiple paragraphs, a diagram will almost always communicate it faster.
Key benefits
| Benefit | What it means for you |
|---|---|
| No context switching | Create and update diagrams without ever leaving Document360. Everything happens in the editor. |
| Always editable | Every diagram retains its source syntax. Edit at any time without having to recreate from scratch. |
| Fast with templates | 23 ready-to-use templates let you start with a real diagram in seconds, not minutes. |
| Consistent quality | Text-based diagrams follow a defined structure, keeping your documentation standardized. |
| Lightweight rendering | Diagrams are stored as SVG images, resulting in fast load times and no runtime JavaScript dependencies for readers. |
| Download anywhere | Export any diagram as PNG or SVG for presentations, external docs, or print. |
Inserting a Mermaid diagram
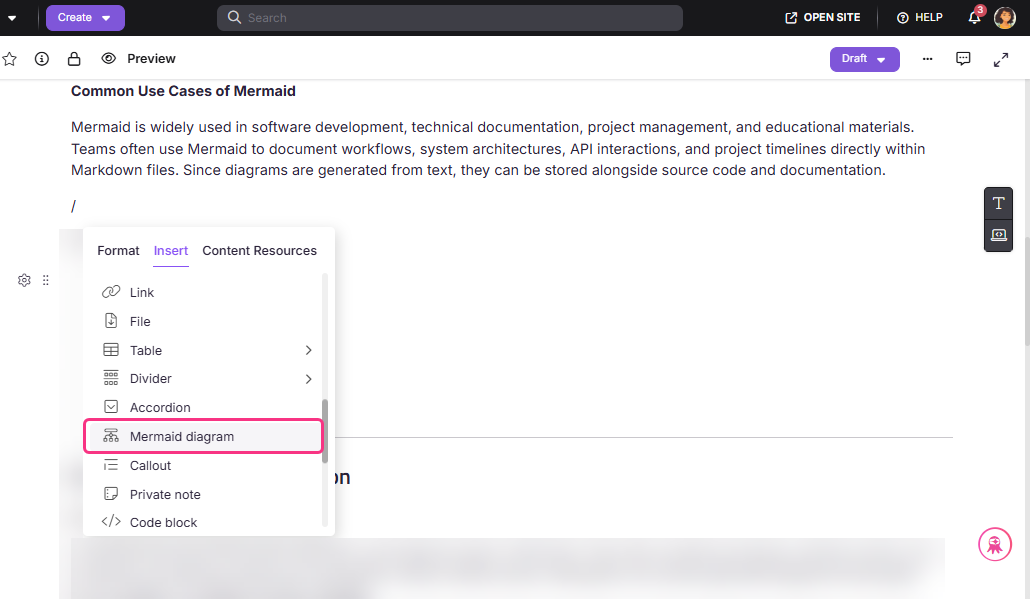
To insert a Mermaid diagram into your article:
- Click inside the article body where you want the diagram to appear.
- Type
/(forward slash) to trigger the slash command menu. - Type Mermaid to filter the suggestions.
- Select Mermaid diagram from the dropdown.
Picking a template
Once you trigger the Mermaid diagram insertion, the template selection modal appears. This is where you choose the starting point for your diagram.
- From a template — Browse or search the 23 available templates, then click one. The editor opens with that template's syntax pre-loaded.
- From blank — Click Blank to open the editor with an empty syntax panel. Use this only if you already know Mermaid syntax.
Choosing a template
- Browse the 23 template cards or type a keyword (e.g. flow, sequence, gantt) in the search bar.
- Click the template card that matches what you want to create.
- The editor opens with that template's syntax pre-loaded. Edit it further to fit your content.
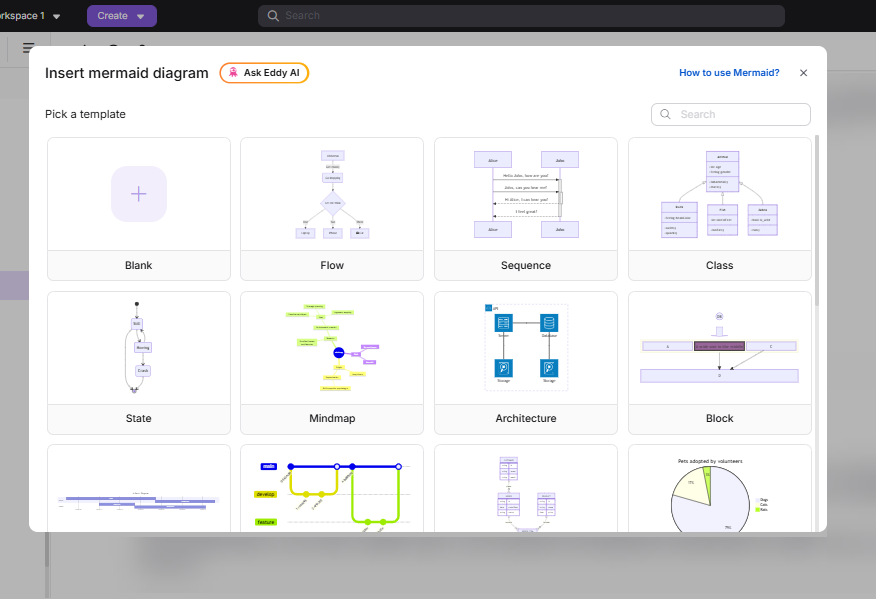
Always start from a template, even if you plan to change everything. Templates give you valid syntax to build from, which avoids parse errors.
Using a blank canvas
- Click the Blank option in the template grid.
- The editor opens with an empty syntax panel.
- Type your Mermaid syntax from scratch.
Use the Blank option only if you already know the Mermaid syntax for your diagram type. If you are unsure, pick a template first.
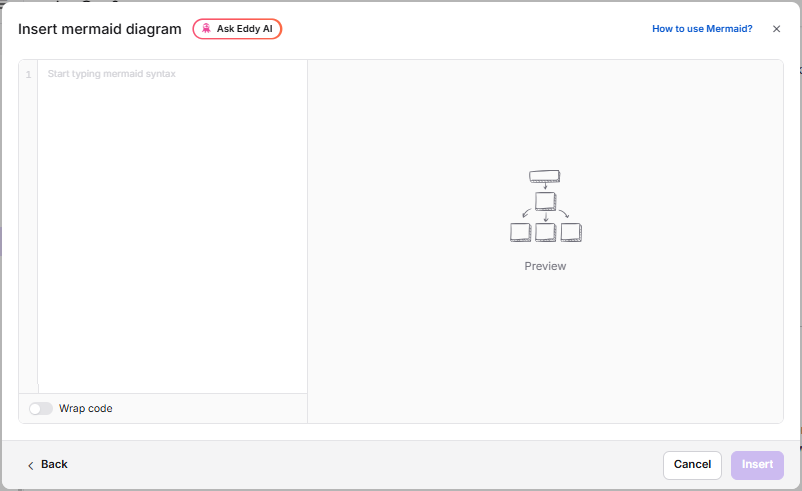
Writing and previewing your diagram
The Mermaid diagram editor is a two-panel workspace. The left panel is where you write your Mermaid syntax. The right panel shows you a live preview of the diagram as you type.
-
Start with a diagram type declaration on the first line. This tells Mermaid what kind of diagram to render.
Diagram type First line Flowchart (top to bottom) graph TDFlowchart (left to right) graph LRSequence diagram sequenceDiagramClass diagram classDiagramGantt chart ganttState diagram stateDiagram-v2Entity-relationship diagram erDiagramPie chart pieMindmap mindmap -
Add nodes, connections, and labels on the following lines. Each line you type immediately updates the preview on the right.
-
If you are working from a template, simply replace the placeholder text with your own labels and connections.
If your syntax has very long lines (e.g. long node labels or detailed edge descriptions), click the Wrap code toggle below the syntax panel to wrap long lines within the visible editor width. This does not affect the diagram output — it only changes how the code appears in the editor.
Preview controls
The right panel updates instantly as you type. Use the preview controls to inspect your diagram before inserting it.
Zoom in / Zoom out — Click the zoom in (+) or zoom out (−) buttons to increase or decrease the magnification of the preview. Use this to inspect specific parts of a complex diagram without affecting the actual diagram size in the article.
Fit to screen — Click the fit to screen ( ) icon to reset the zoom level so the entire diagram is visible in the preview area without scrolling. Use this for a final review before inserting.
Expand / Collapse — Click the expand ( ) icon in the preview panel toolbar to hide the syntax editor and expand the preview to fill the full modal width. Click the collapse ( ) icon to return to the split-panel view and continue editing.
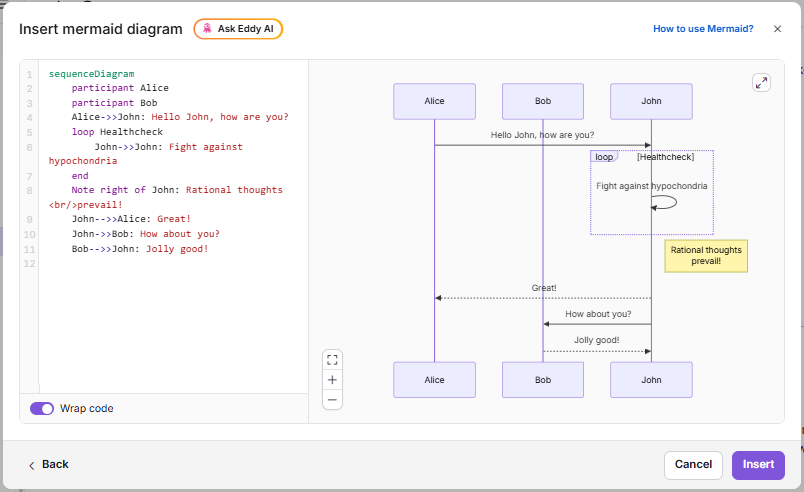
Fullscreen is view-only. Your syntax is preserved exactly as you left it — switching to full screen and back makes no changes.
Handling syntax errors
If your syntax is invalid, the preview shows an error and the Insert button is disabled.
- Read the error message. It includes the line number causing the issue.
- Fix that line in the syntax panel.
- The preview updates automatically. Once valid, the Insert button becomes active.
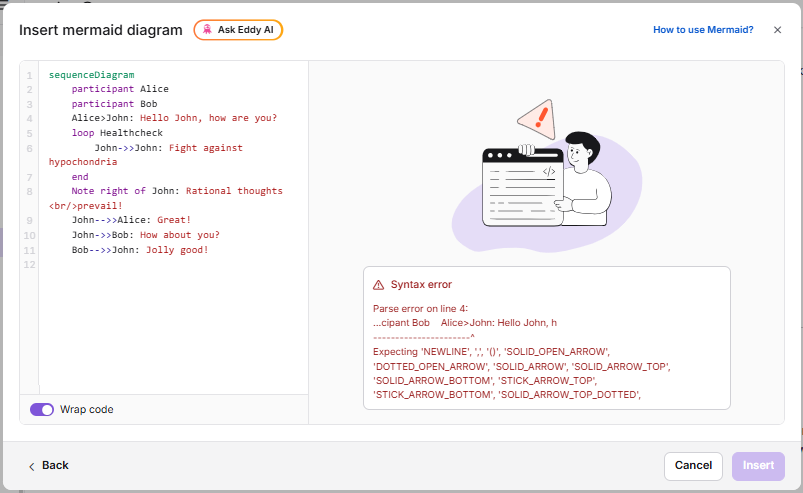
Common errors and fixes
| Symptom | Fix |
|---|---|
Parse error on line 1 |
Your first line is not a valid diagram declaration. Check the diagram type table above. |
| Button stays disabled after fixing | Scroll the error output — there may be a second error lower down. |
| Blank preview, no error | Syntax is valid but empty. Add at least one node or connection. |
| Node label breaks the render | Wrap the label in double quotes: A["Label / With Slash"] --> B |
| Arrow not rendering | Flowcharts use -->. Sequence diagrams use ->>. Using the wrong type causes an error. |
The Insert button will remain disabled as long as the syntax has any error. Do not try to work around this — fix the error first.
Inserting the diagram into the article
Once the preview is correct and error-free, click Insert. Document360 converts the diagram to an SVG image and places it at your cursor position.
Two things are saved for every diagram:
- The rendered SVG image — visible in the article and on the KB site.
- The Mermaid syntax — stored privately, used when you edit the diagram later.
Managing an inserted diagram
Click on any inserted diagram to open the bubble menu.
| Action | Description |
|---|---|
| Alignment | Set the diagram to Left, Center, or Right alignment within the article column. Center is the most common choice for diagrams. |
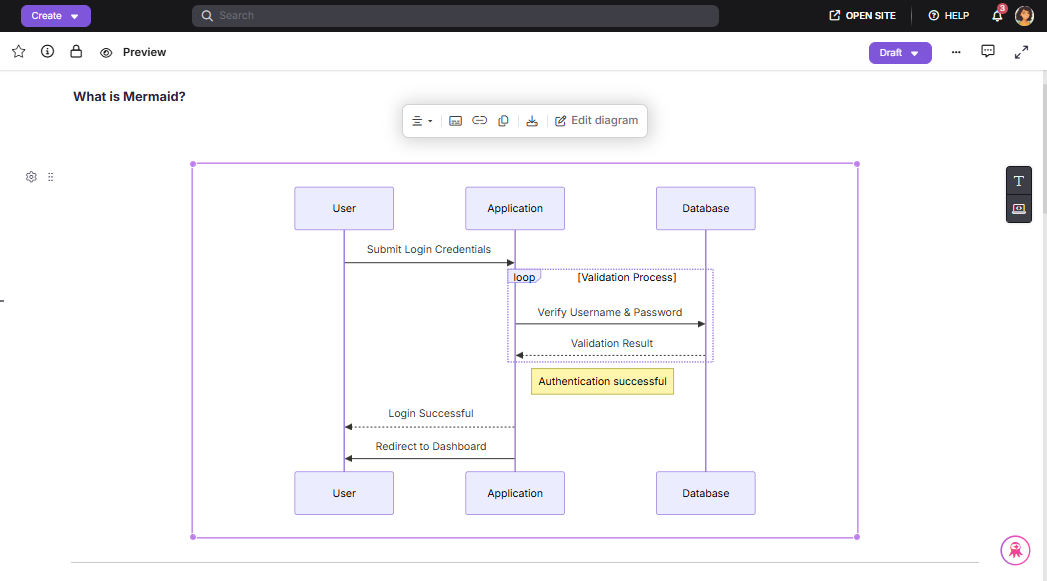
| Caption | Add a caption below the diagram — for example, Figure 1: Support ticket routing flow. Captions are visible to readers on the KB site. |
| Link | Attach a hyperlink to the diagram. When readers click the diagram on the KB site, they are taken to the linked URL. Useful for linking to a related article or specification document. |
| Copy | Copies the diagram and its syntax. Paste elsewhere in the same article to create an independent, editable copy. |
| Download PNG | Downloads the diagram as a high-resolution PNG image file to your browser's downloads folder. |
| Download SVG | Downloads the diagram as a scalable SVG vector file. Recommended for presentations and print. |
| Edit Mermaid diagram | Opens the editor with the diagram's original syntax pre-loaded. Make changes and click Update to save. |
Editing an existing diagram
Every Mermaid diagram you insert can be edited at any time, even after the article has been published. The original syntax is always stored.
- Click the diagram, then click Edit diagram in the bubble menu.
- The editor opens with the stored syntax and a live preview.
- Make your changes.
- Click Update. The diagram in the article is replaced; position and alignment are preserved.
If you click Cancel or (X) after making changes, a confirmation dialog appears. Click Yes, discard to exit without saving, or No, go back to continue editing.
Discarded changes cannot be recovered. There is no undo for the discard action.
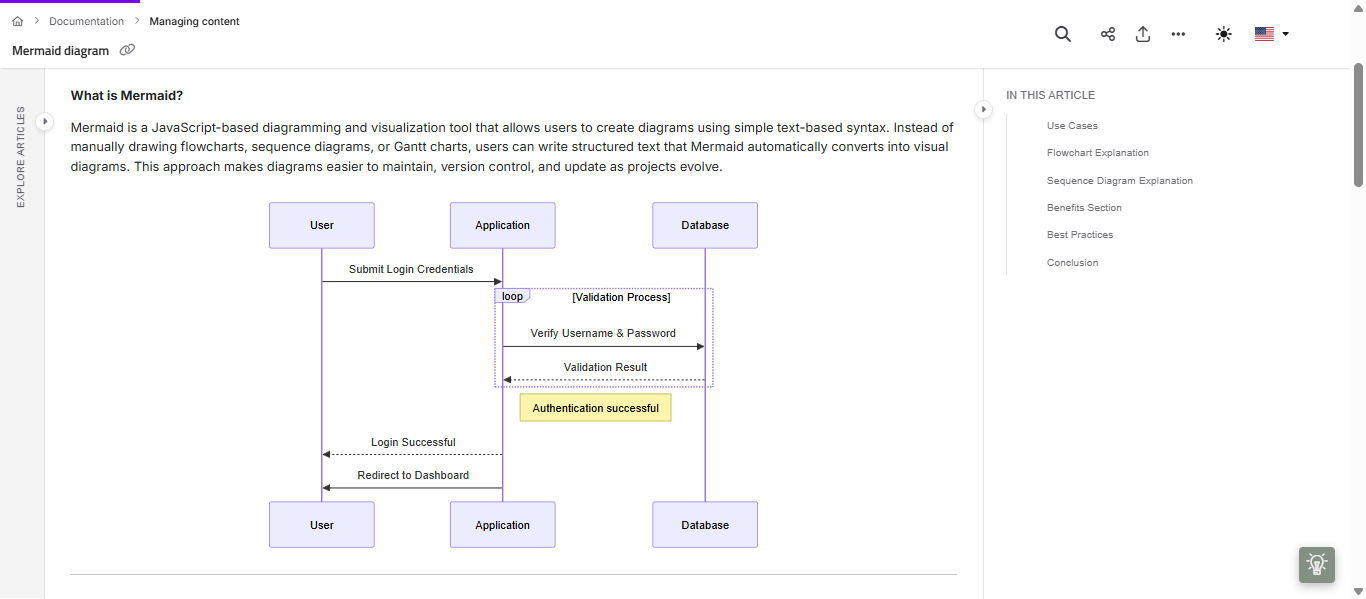
How readers see your diagrams
On the knowledge base site, diagrams appear as static SVG images embedded in the article. Readers can click any diagram to open a full-screen overlay, which is useful for large or complex diagrams. Editing controls and source syntax are never exposed to readers.
Best practices
- One diagram, one idea. If a flowchart exceeds 15–20 nodes, split it into an overview diagram and a detail diagram.
- Always add a caption. Use the caption option in the bubble menu to label every diagram. It helps readers understand context at a glance.
- Use SVG for external use. SVG is infinitely scalable with no quality loss. Use PNG only when the destination tool doesn't support SVG.
- Copy to duplicate, not to rebuild. Use the Copy bubble menu action to duplicate a diagram. Each copy has independent syntax — editing one does not affect the other. Pasting a Mermaid diagram outside of Document360 (e.g. into another tool) will only paste the image, not the source syntax.
Available templates
The following templates are available in the Template Selection screen. Search by name or keyword to find the right one quickly.
| # | Template | Best used for |
|---|---|---|
| 1 | Flowchart - Top Down | Step-by-step processes, decision trees, approval flows |
| 2 | Flowchart - Left to Right | Horizontal pipelines, CI/CD stages, data flows |
| 3 | Sequence Diagram | API interactions, authentication flows, system calls |
| 4 | Class Diagram | Object-oriented design, data models, database schemas |
| 5 | State Diagram | UI states, order lifecycle, session management |
| 6 | Entity Relationship Diagram | Database tables, domain models, data relationships |
| 7 | User Journey | Customer experience flows, onboarding paths |
| 8 | Gantt Chart | Project timelines, sprint planning, roadmaps |
| 9 | Pie Chart | Data distributions, percentage breakdowns |
| 10 | Quadrant Chart | Priority matrices, risk grids, effort/impact maps |
| 11 | Requirement Diagram | System requirements, feature traceability |
| 12 | Gitgraph Diagram | Git branching strategies, release workflows |
| 13 | Mindmap | Brainstorming, topic breakdowns, concept maps |
| 14 | Timeline Diagram | Milestone tracking, product history, chronologies |
| 15 | Sankey Diagram | Data flow volumes, resource allocation |
| 16 | XY Chart | Trend lines, performance metrics, data plots |
| 17 | Block Diagram | System components, infrastructure, architecture |
| 18 | Packet Diagram | Network packet structures, protocol documentation |
| 19 | Kanban Diagram | Task boards, sprint tracking, workflow stages |
| 20 | Architecture Diagram | Cloud architecture, service topology, system maps |
| 21 | ZenUML Sequence | Simplified UML sequence for quick comms flows |
| 22 | C4 Context Diagram | Software system context, stakeholder relationships |
| 23 | Blank | Write any valid Mermaid syntax from scratch |
FAQ
Can I use Mermaid diagrams in the Markdown editor?
No. Mermaid diagrams are only available in the Advanced WYSIWYG editor.
Can I add Mermaid diagrams to snippets or glossary terms?
Yes. Diagrams render correctly when the snippet is reused across articles.
Is there a maximum diagram size?
There is no hard limit. However, very large diagrams (e.g. flowcharts with 50+ nodes) may be difficult to read at article width. Use the full-screen preview on the KB site for large diagrams, and consider splitting a very large diagram into multiple smaller ones with an article section for each.
How do Mermaid diagrams appear in PDF exports?
They are rendered as images in the exported PDF, retaining their clarity and resolution.
Why does the diagram look distorted on the KB site?
The KB site column may be narrower than the editor preview. Try switching from graph TD to graph LR for wide diagrams, or split the diagram into two smaller ones. Avoid hardcoded colors in node labels as they may not display correctly in dark mode.