The Articles analytics page is divided into several sections, each providing a different lens into your knowledge base performance. This reference describes what each section measures and how to interact with it.
When to use each analytics section
| Section | Use it to… |
|---|---|
| Article performance | Get a high-level snapshot of total views, reads, likes, and dislikes |
| Most read articles | Identify content that holds reader attention for the longest time |
| Top articles list | Find the articles with the highest traffic and engagement |
| Location-based views | Understand which regions your readers come from |
| Top categories | Evaluate which content areas drive the most engagement |
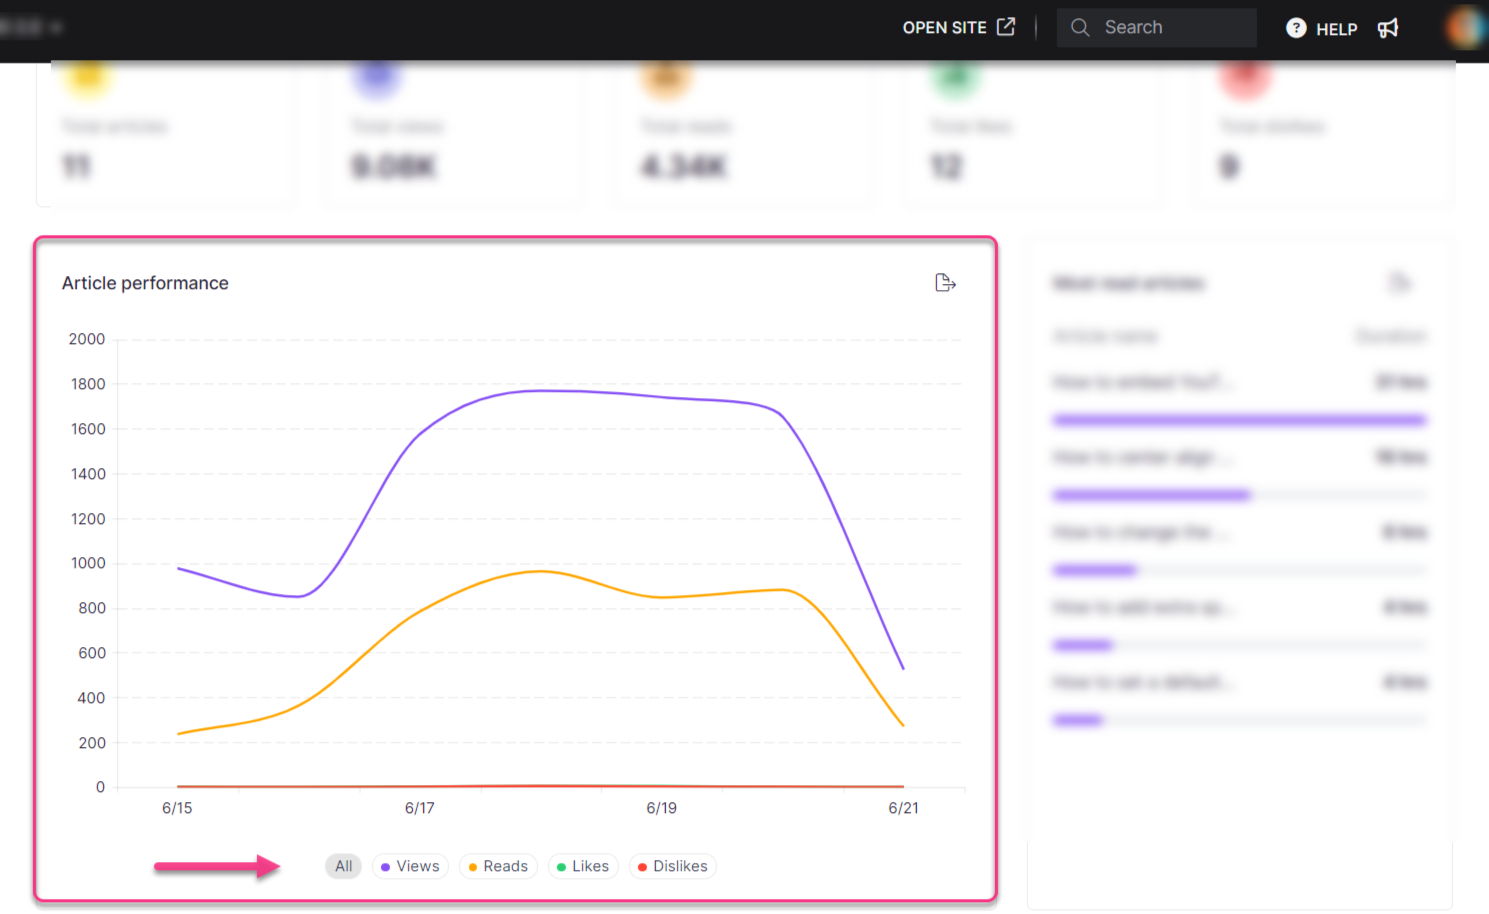
Article performance
The Article performance section displays cumulative metrics as tiles. Total views, reads, likes, and dislikes include data from deleted articles.
| Metric | Description |
|---|---|
| Published articles | Total unique articles published within the selected date range, based on applied filters. Deleted articles are excluded. |
| Total views | Number of times an article is accessed, counted once per browser session. A view is recorded when the article fully loads, regardless of user interaction. Multiple visits to the same article within a session count as one view, even across tabs or windows. Opening the same article in a different browser, clearing cache, or refreshing counts as a new view. A browser session resets every 24 hours. |
| Total reads | Number of meaningful article engagements. A read requires all four of the following: at least one scroll, a click, a minimum of 10 seconds of active time on the page, and continued engagement (the timer pauses when a user becomes idle or switches tabs). A read is also registered if the user clicks Play to hear the article read aloud. Revisiting the same article within 24 hours in the same browser session adds to the previous session's total. |
| Total likes | Total number of likes the articles have received. |
| Total dislikes | Total number of dislikes the articles have received. |
The aggregated data for views, reads, likes, and dislikes within the selected date range is displayed in both numeric and graphical formats. Click the legend items at the bottom of the graph to show or hide individual data points. Click Export image () to save the section as a PNG image.
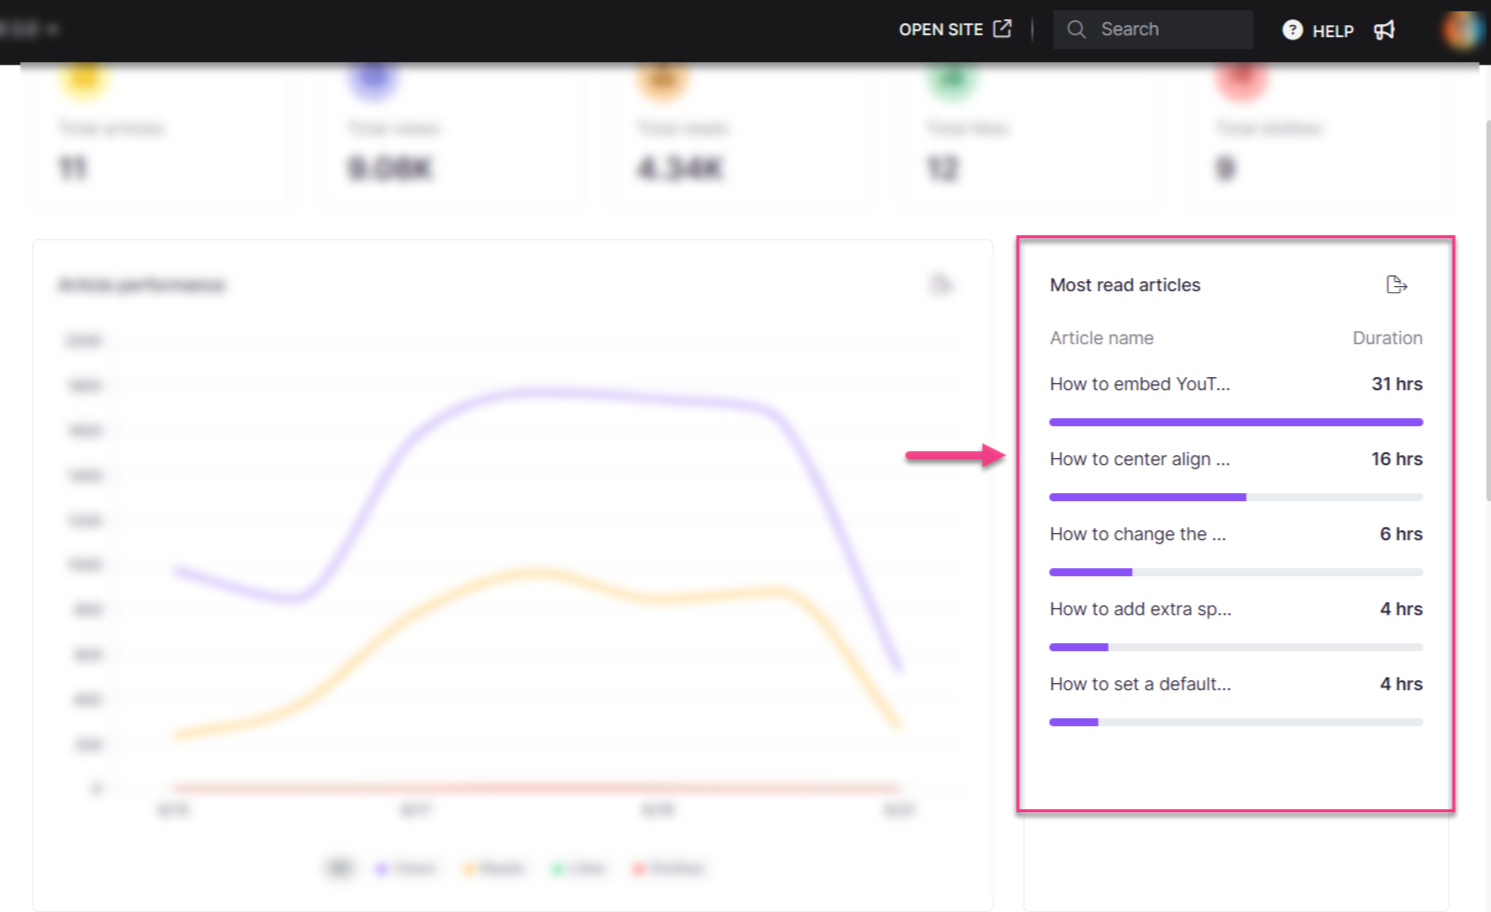
Most read articles
This section lists the top five articles based on total read time. Article names are displayed on the left and duration (in hours or minutes) on the right.
- Click Export image () to save the section as a PNG image.
- Hover over an article title and click View in Knowledge base () to open the article in the Knowledge base site.
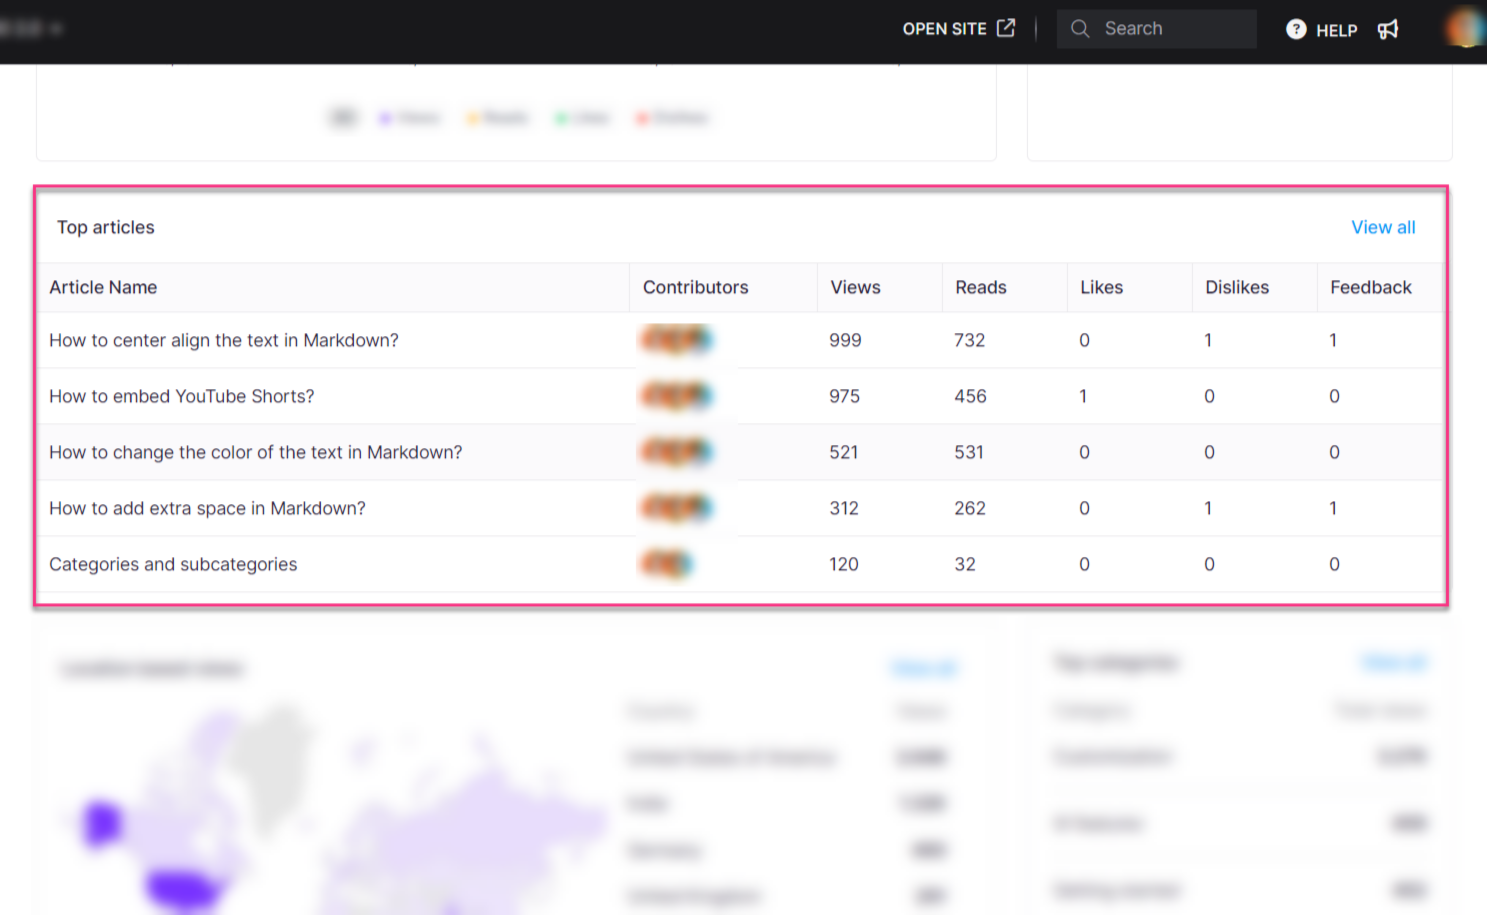
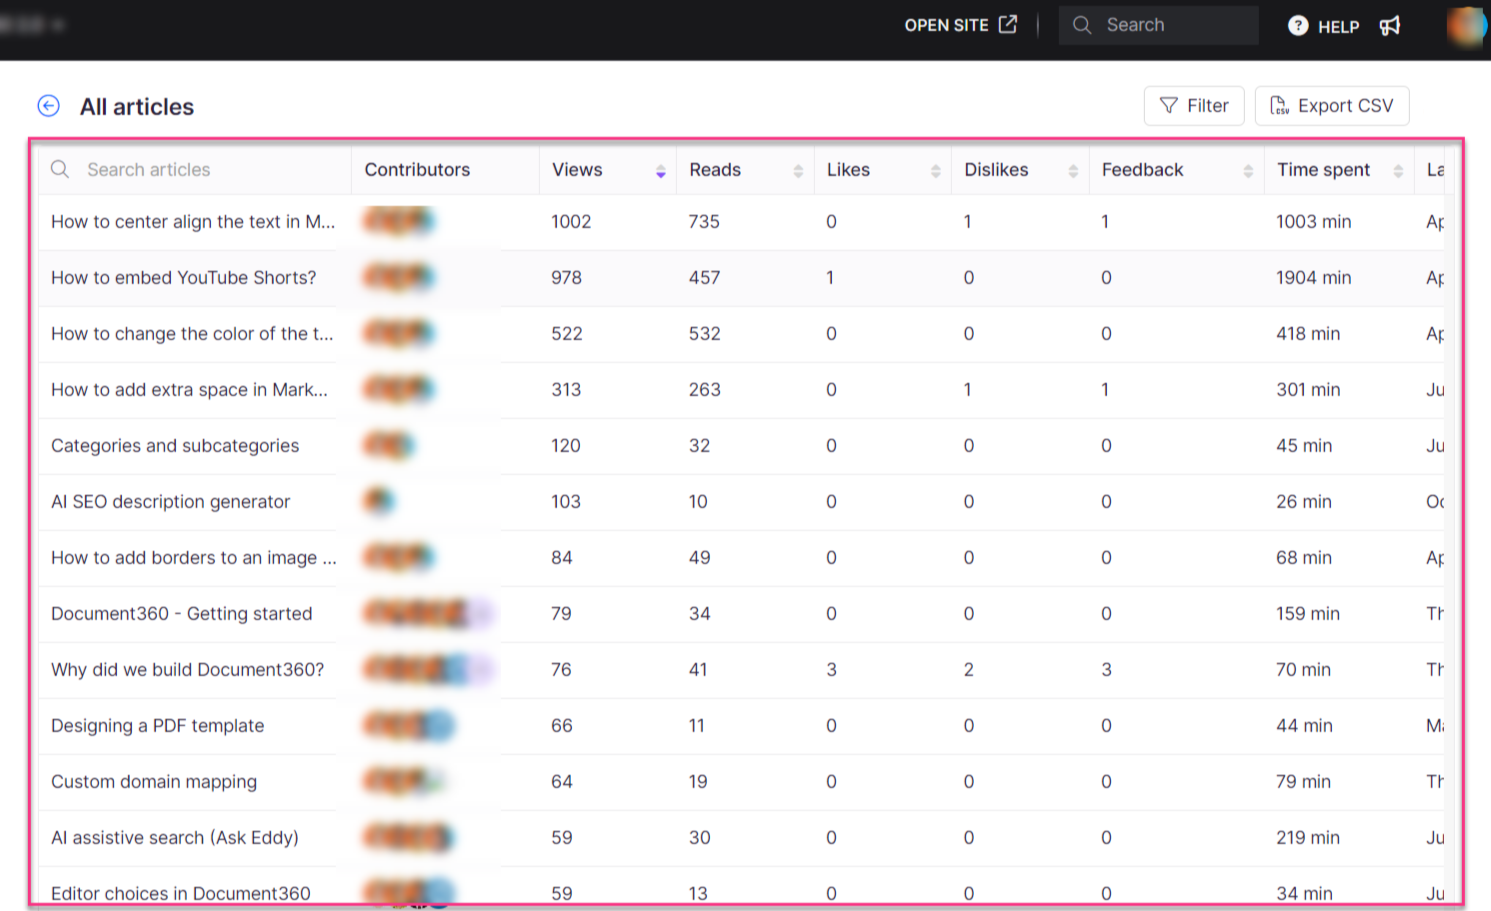
Top articles list
This section lists the top five articles ranked by views, showing Article name, Contributors, Views, Reads, Likes, Dislikes, and Feedback.
- Hover over an article title and click View in Knowledge base () to open the article in the Knowledge base site.
- Click View all to see every article in your knowledge base, along with Time spent, Last updated, and Last viewed dates.
- Deleted articles are not included in this list.
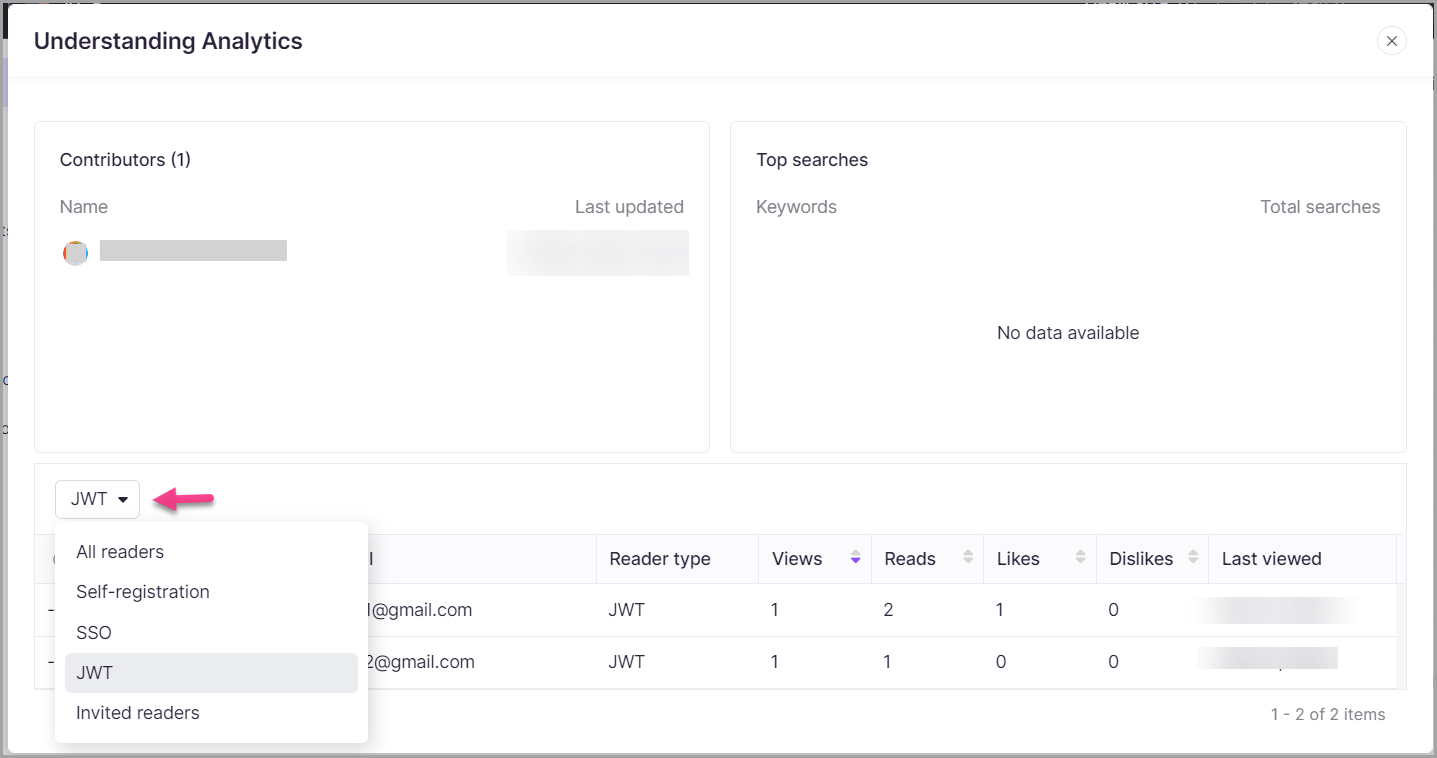
Drilling into a specific article
Select any article from the list to view its detailed analytics. On the detail page, you can filter readers by:
- All readers
- Self-registration
- JWT
- Invited readers
You can further filter the full article list using:
| Filter | Options |
|---|---|
| Article type | All, Page, Article |
| Contributors | All users |
| Date | 7 days, 30 days, Custom date |
| Category | All categories in the workspace |
| Read receipt | All, Yes, No |
- Click Export CSV to download the article list.
- Click the back arrow () at the top left to return to the Articles analytics page.
Location-based views
This section displays a world map highlighting countries based on article views. View data is derived from the IP addresses of users who accessed the articles. A table beside the map lists the top five countries by views (including views from deleted articles). All remaining countries are grouped under Others.
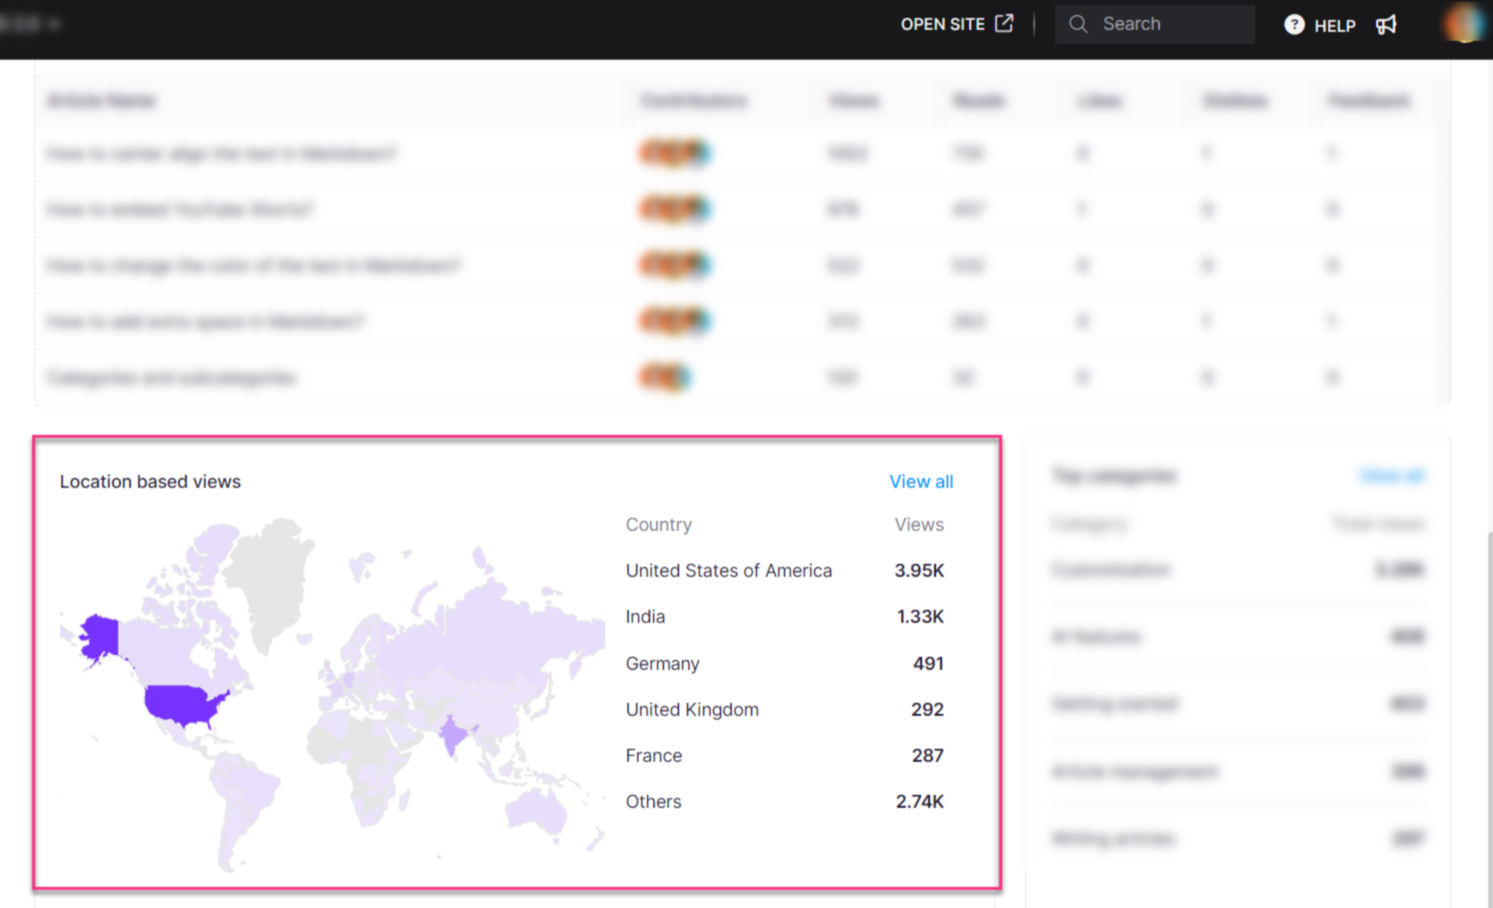
- Click View all to open a detailed country-by-country breakdown.
The View all list displays tiles for total views, reads, likes, and dislikes. Unlike the main page, this count does not include deleted articles.
In the detailed view:
- All countries with at least one view are listed. Scroll the left-side list or search by country name.
- For each country, you can see article names, views, reads, likes, dislikes, and average time spent.
- Filter the data by article type and date.
- Click Export CSV to download data for the selected country. To export data for multiple countries, repeat the export for each one.
- Click the Close (X) icon at the top right to return to the Articles page.
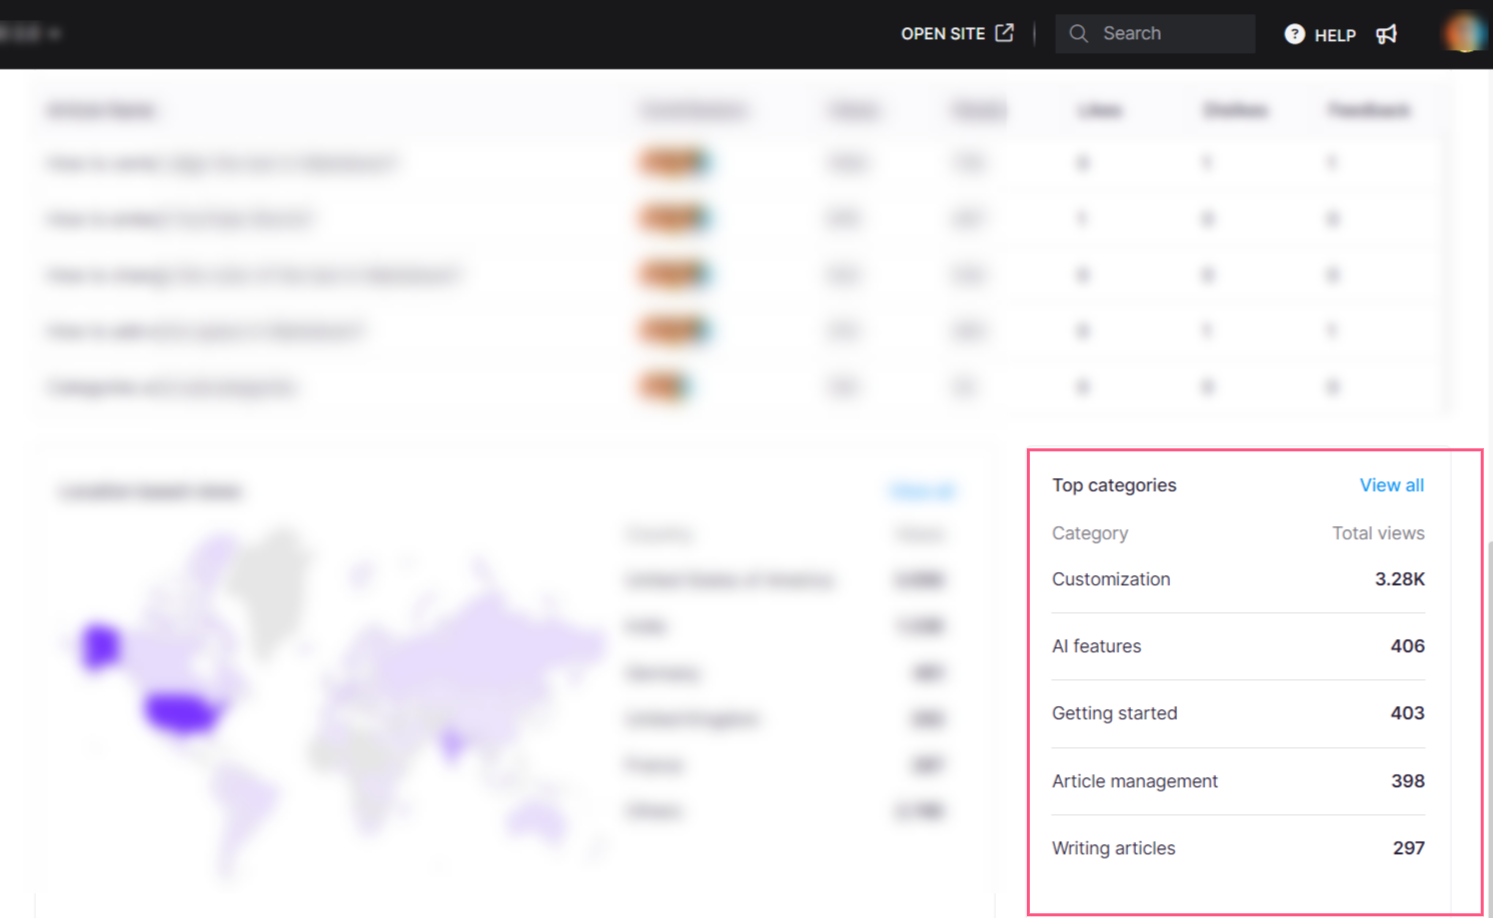
Top categories
This section displays the top categories ranked by views (including views from deleted articles), showing the category name and total views.
- Click View all to see the full category list, including category name, number of articles, views, reads, likes, dislikes, and time spent (minutes).
The View all list does not include deleted articles, unlike the main page count.
- Filter the category list by category type: All, Folder, Page, or Index.
- Click Export CSV to download the category list.
- Click the back arrow () at the top left to return to the Articles page.
Best practices
- Review analytics regularly. Set a weekly or monthly cadence to check performance trends before content becomes stale.
- Act on the views-to-reads gap. A high view count with low reads suggests the introduction or page structure is not holding attention. Revise openings, simplify structure, and add visuals.
- Use location data to prioritize localization. If a significant portion of readers come from a non-English-speaking region, consider translating or localizing high-traffic articles.
- Address low-rated articles promptly. Frequent dislikes on an article are a signal to review the content for missing steps, broken images, or outdated information.
FAQ
Why do the Most read articles and Top articles sections show different articles?
The Most read articles section lists the top five articles with the longest total read time during the selected period. The Top articles section lists the top five articles ranked by views and reads consolidated over the same period. Because the ranking criteria differ, the articles appearing in each section may not match.
How long is data shown in the individual article analytics section?
The individual article analytics section shows data for the last 30 days. To view data using filters such as Last week, Last month, or a Custom date, go to Analytics > Articles and apply the required filter.
Which user roles can access the Analytics section?
Admins, Owners, and Contributors with an Editor or Draft writer content role can access Analytics. To restrict access, create a custom content role with the Analytics permission unchecked and assign it to the relevant users. See Roles and permissions for details.
Can I see the file size before exporting?
Document360 does not currently display the file size before export. After downloading, you can check the file size on your local device.
How are reads tracked for short articles that do not require scrolling?
For shorter articles where scrolling is not necessary, a read is counted if the user clicks on the article and spends at least 10 seconds engaging with the content. Scrolling is not required for a read to be recorded in this case.
How should I use Article analytics to evaluate content performance?
Start with the overview metrics — views, reads, likes, and dislikes — to assess visibility, engagement depth, and user sentiment. Use Most read articles to identify content that retains attention, and Top articles to find the highest-traffic content. Apply date, user type, article type, and category filters to analyse specific segments. Use location data to understand regional access patterns and category data to evaluate different areas of your knowledge base.
What actions should I take to improve article performance?
The right action depends on which metric is underperforming:
- Low views: Improve discoverability by refining titles, adding internal links, reorganising categories, or improving SEO.
- Low reads relative to views: Strengthen introductions, simplify content, improve structure, and add visuals or examples to keep readers engaged.
- Low likes or frequent dislikes: Review user feedback and update unclear, outdated, or incomplete sections. Fix missing steps, broken images, or confusing terminology.
For articles performing well, identify what works — tone, structure, or presentation — and apply those patterns across other content.
Why does the Reads count differ between the All articles page and the individual article details page?
The two pages use different reporting levels:
- The All articles analytics page shows total reads for each article, including activity from both User and Reader accounts.
- The individual article analytics details page shows detailed interaction records for Reader accounts only.
As a result, the total reads on the All articles page may be higher than the count shown in the individual article view. This is expected behaviour and helps separate overall performance metrics from reader-level engagement details.