MCP server analytics gives project owners and administrators visibility into how their knowledge base is being accessed through the Model Context Protocol (MCP) server. You can track call volumes, success and failure rates, tool usage, active users, client distribution, and search activity from one dashboard. Use it to measure the value of your MCP integration and understand how AI assistants and team members are interacting with your knowledge base.
Why use MCP server analytics
- Use it to confirm MCP is actively being used after setup and identify whether adoption is broad or limited to a few users.
- Use it to investigate failure spikes and pinpoint whether issues are concentrated in read or write operations.
- Use it to understand which MCP tools and AI clients are used most, so you can optimize access configuration and plan enablement.
Access MCP server analytics
In the knowledge base portal, navigate to Analytics () in the left navigation bar, then click MCP server in the left navigation pane.
Any team member with view analytics permission can access the dashboard.
The dashboard opens showing data for the last 7 days by default. Click the Date filter dropdown and select Last week, Last month, or Custom date to adjust the date range.
Dashboard overview
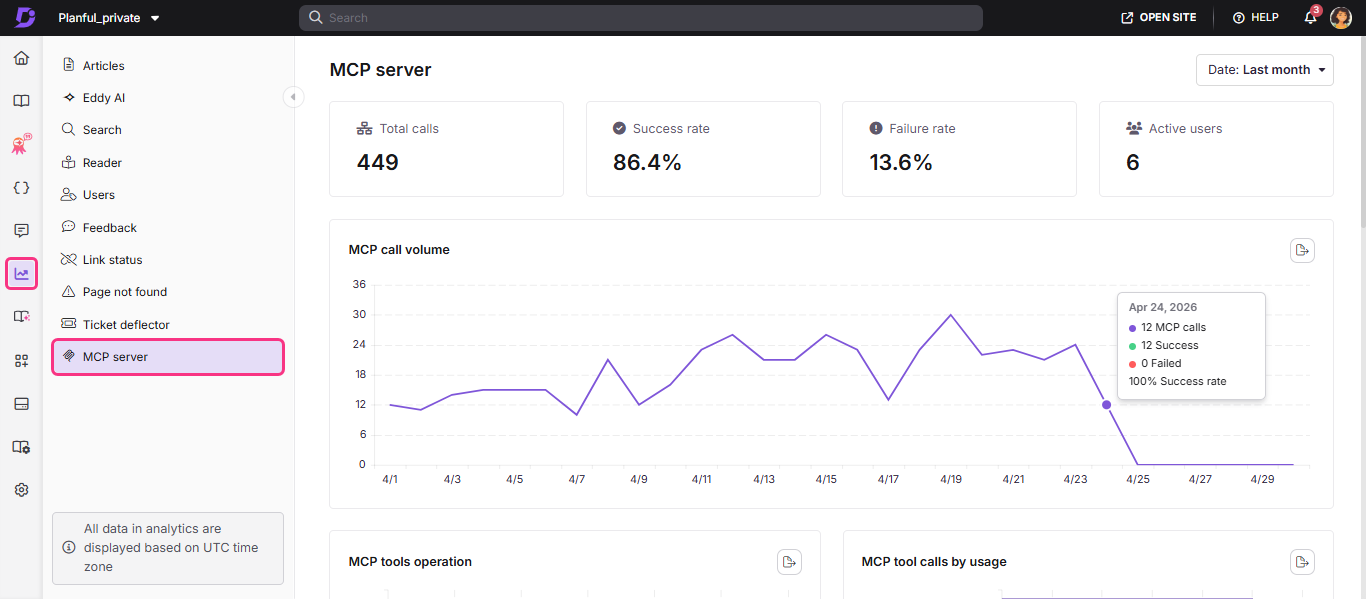
The top of the dashboard shows four KPI cards summarizing activity for the selected period:
| Metric | Description | How this helps |
|---|---|---|
| Total calls | Total number of MCP calls made in the selected period. | Shows whether MCP is actively being used. If calls are lower than expected, check whether MCP assistants are connected correctly and whether users are aware that MCP access is available. |
| Success rate | Percentage and count of successfully completed MCP calls. | Shows whether connected MCP clients can retrieve or perform actions successfully. A drop in success rate can indicate authentication issues, permission restrictions, or request failures from the connected client. |
| Failure rate | Percentage and count of failed MCP calls. | Highlights whether MCP requests are repeatedly failing. If failures are high, use the MCP tools operation chart to identify whether failures are concentrated in Read or Write operations, then review client configuration, permissions, and rate limits. |
| Active users | Number of unique users who made at least one MCP call in the selected period. | Shows whether MCP usage is distributed across the team or concentrated among a few users. If total calls are high but active users are low, consider broader enablement or training. |
The MCP server analytics dashboard remains accessible even if MCP is disabled in your AI settings, as long as data exists for the selected date range. Disabling MCP stops new data from being collected but does not remove existing analytics. For example, if MCP was enabled last month and later disabled, you can still select last month in the date filter to review calls, users, clients, and tool usage from that period.
Charts
The Charts section provides a detailed breakdown of MCP usage trends across call volume, tool performance, user activity, client distribution, and search activity.
MCP call volume shows day-by-day MCP call activity across all users. Hover over any point to see total calls, success count, failure count, and success rate for that day.
MCP tools operation shows the distribution of MCP calls by operation type (Read and Write), segmented by success and failure counts. Use this to understand whether your MCP usage is primarily read-heavy (content retrieval) or write-heavy (content creation and editing). Click All, Success, or Failed to filter the view.
MCP tool calls by usage shows how frequently each MCP tool was called during the selected period, ranked by volume. Hover over any bar to see total calls, success count, failure count, and success rate for that tool. To learn what each tool does, see Supported MCP tools.
Top users displays the top users ranked by MCP call volume. The top 5 are shown by default. Hover over any bar to see that user's call stats. Click View all to see the full list, where you can sort by call volume or search for a specific user.
Top MCP clients displays the top AI assistants connecting to your MCP server, ranked by call volume. The top 5 are shown by default. Hover over any bar to see call stats. Click View all to see the complete list.
MCP search tool shows the number of daily search queries made specifically through the Search tool, separate from broader MCP tool calls. Use this to understand how frequently AI assistants are searching your knowledge base and whether search volume is growing over time.
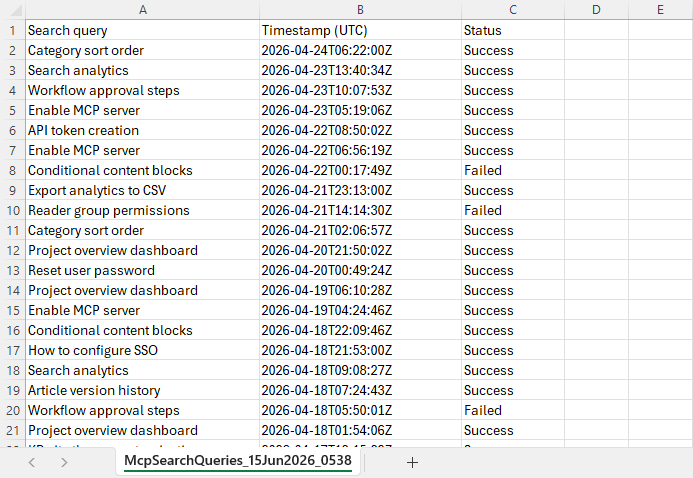
All charts can be exported as a PNG image using the export icon () on the top right of each chart. The MCP search tool chart additionally supports CSV export, which includes the search query, timestamp, and status for each entry.
Best practices
- Monitor the failure rate after any MCP configuration change. A sudden increase in failures after a change to permissions, tokens, or client settings is a strong signal that the change introduced an issue.
- Use the MCP tools operation chart to triage failures. If failures are concentrated in Write operations, the issue is likely a permissions or content-role restriction. If Read failures are high, check authentication and rate limits.
- Compare Total calls against Active users. A high call volume with low active users suggests MCP is heavily used by a small group. Consider whether broader team enablement would add value.
- Review the Top MCP clients chart after onboarding new AI assistants. Confirming a new client appears in the chart is a quick way to verify the connection is working correctly.
- Export MCP search tool data as CSV for deeper analysis. The search query and status columns let you identify which queries are failing, so you can improve knowledge base coverage for those topics.
FAQ
Why can I still see the MCP server analytics dashboard after disabling MCP?
The dashboard displays historical data regardless of whether MCP is currently enabled. Disabling MCP stops new data from being collected but does not remove existing analytics.
What causes MCP call failures?
Common reasons for MCP call failures include:
- Token limit exceeded (plan): The AI assistant has reached its plan-level token limit, preventing further MCP tool calls.
- Token limit exceeded (session): The current session token limit is maxed out. Further calls are blocked until a new session is started, even if overall credits are still available.
- Rate limiting: Too many requests are being made beyond the plan's allowed rate.
- Network interruption: A connectivity issue mid-session caused the call to fail.