Ticket deflector analytics in Document360 gives you an overview of how well your ticket deflector forms are reducing support requests. It tracks how many queries were resolved by your knowledge base articles, how many forms were submitted anyway, and which keywords and articles performed best. You can access it from the Analytics () section in the knowledge base portal.
Why use ticket deflector analytics
- Use it to measure how effectively your knowledge base is deflecting support tickets, so you can identify where content improvements will have the most impact.
- Use it to find the most and least useful articles in your ticket deflector flow, so you can update or expand them.
- Use it to identify frequently selected questions and high-frequency keywords that are not returning answers, pointing to clear content gaps.
How to access ticket deflector analytics
In the knowledge base portal, navigate to Analytics () in the left navigation bar, then click Ticket deflector in the left navigation pane.

The page opens on the Ticket deflector tab, showing data for the last 7 days by default.
Apply filters
- Click the Date filter dropdown and select a predefined range (such as This month or Last month), or choose Custom to specify a date range.
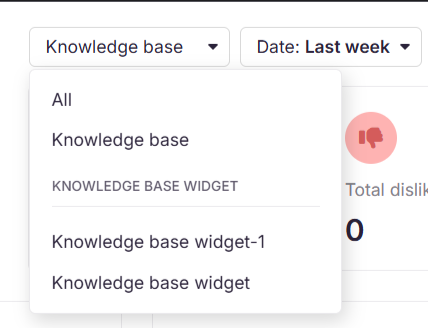
- If you have the Knowledge base widget enabled, use the top-right dropdown to switch between All, Knowledge base, and Widget analytics.
- To track JWT-authenticated user interactions in private or mixed projects, select JWT widget from the dropdown. For more information, see Configure JWT for knowledge base widget.
Ticket deflector analytics data can take up to 15 minutes to reflect in the knowledge base portal.
Ticket deflector tab
The Ticket deflector tab is the default view. It shows four metric tiles at the top:
| Metric | Description |
|---|---|
| Total feedback | Total number of feedback entries, including queries answered from the knowledge base and forms submitted. |
| Answered from knowledge base | Number of queries resolved by articles in the knowledge base, without the user submitting a ticket. |
| Form submitted | Total number of ticket deflector forms submitted. |
| Total search | Total number of searches performed on the Quick support page of the knowledge base. |
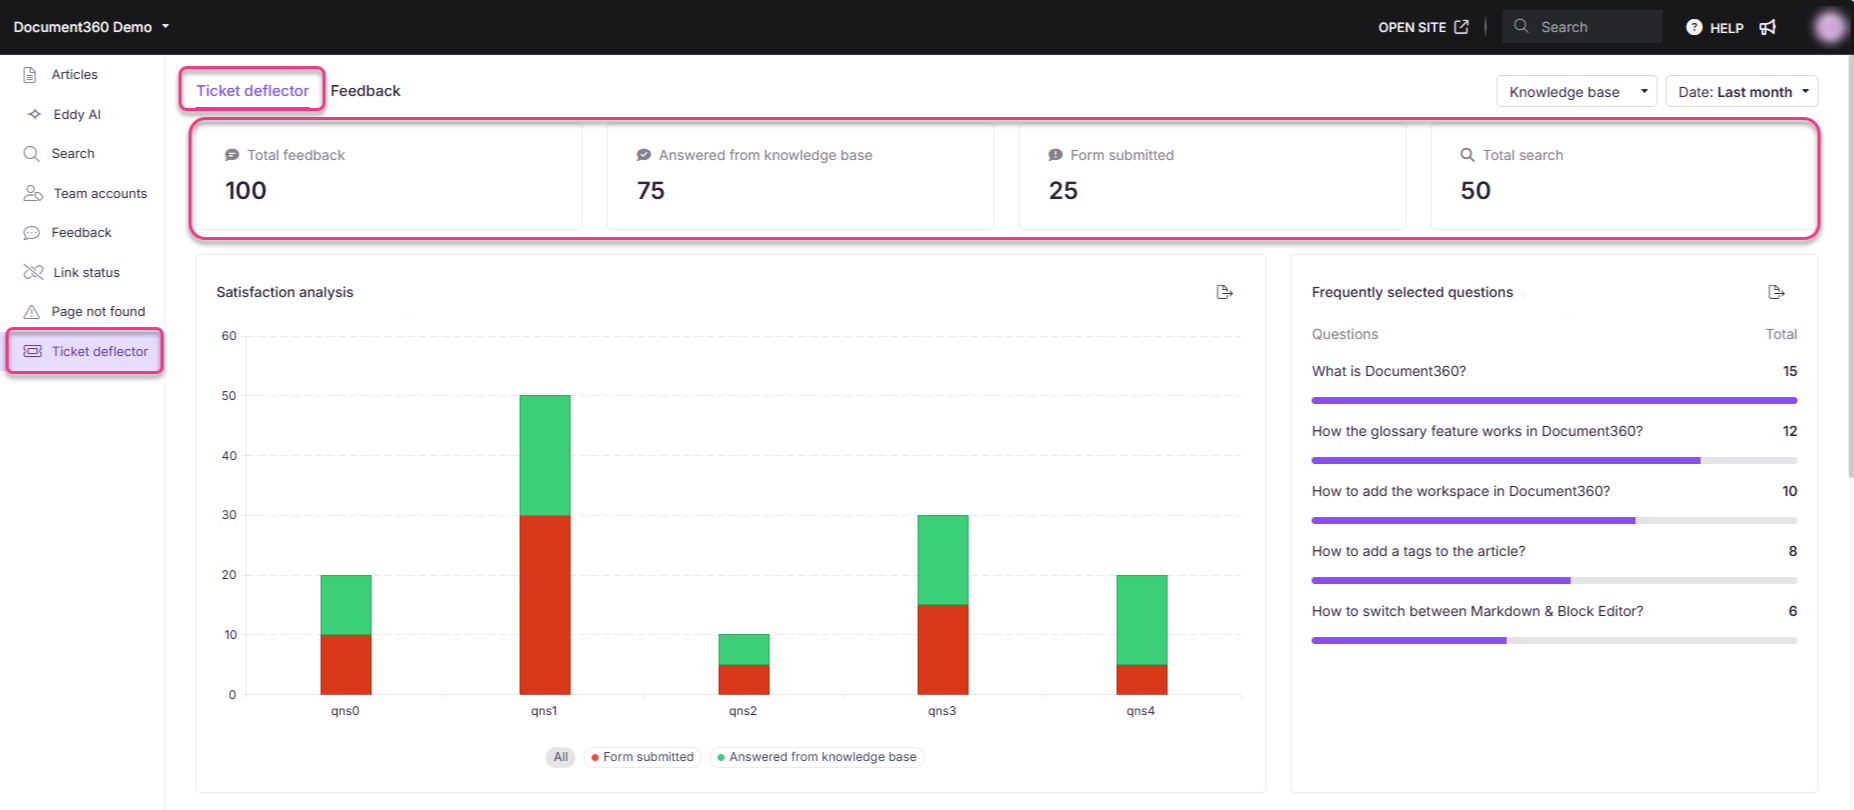
Below the tiles, the tab is divided into the following sections:
Satisfaction analysis
This line graph shows the volume of forms submitted and queries answered from the knowledge base over the selected period. Click the legends at the bottom to toggle between All, Form submitted, and Answered from knowledge base views. Hover over the graph to see exact values for a specific date. Click Export image () to save the graph as a PNG file.
Frequently selected questions
This section lists the top five questions most frequently chosen from the ticket deflector form, along with how often each was selected. Click the export () icon to download the list.
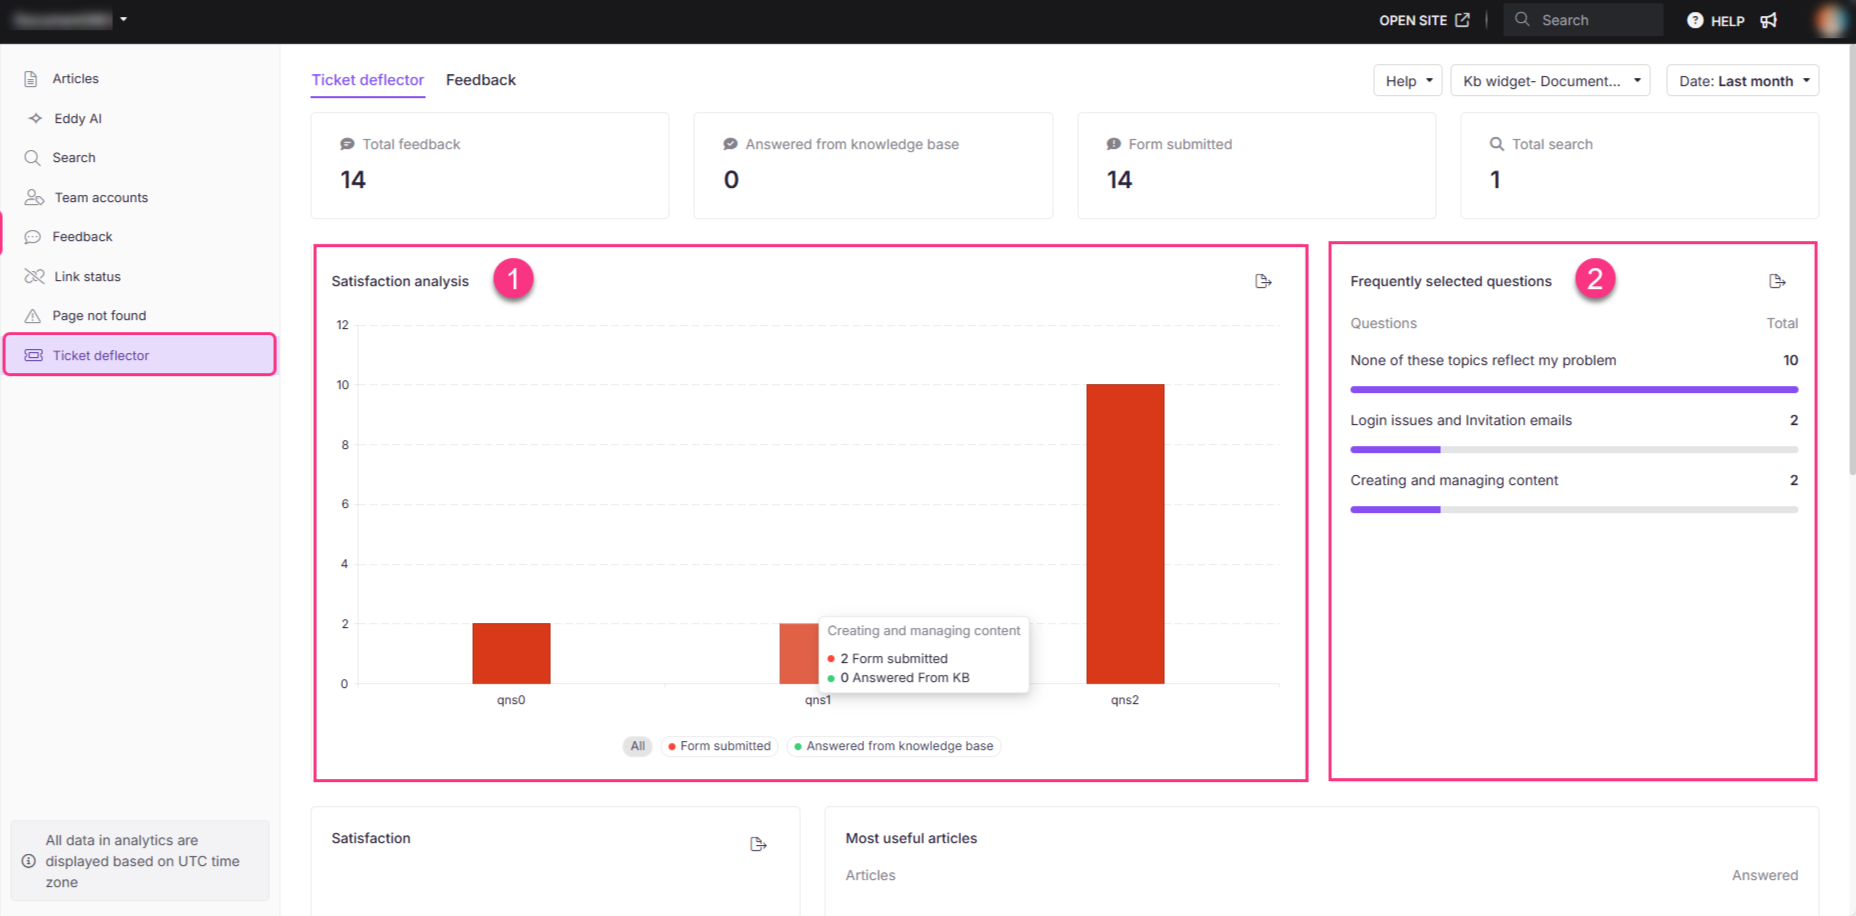
Satisfaction
This pie chart shows the proportion of forms submitted (orange) versus queries answered from the knowledge base (green). Click Export image () to save it as a PNG file.
Most useful articles
This section lists the top articles that successfully resolved user queries in the ticket deflector flow. For each article, the following is shown:
- Article: The article title. Hover over it and click View in knowledge base () to open it on the knowledge base site.
- Answered: The number of queries the article helped resolve.
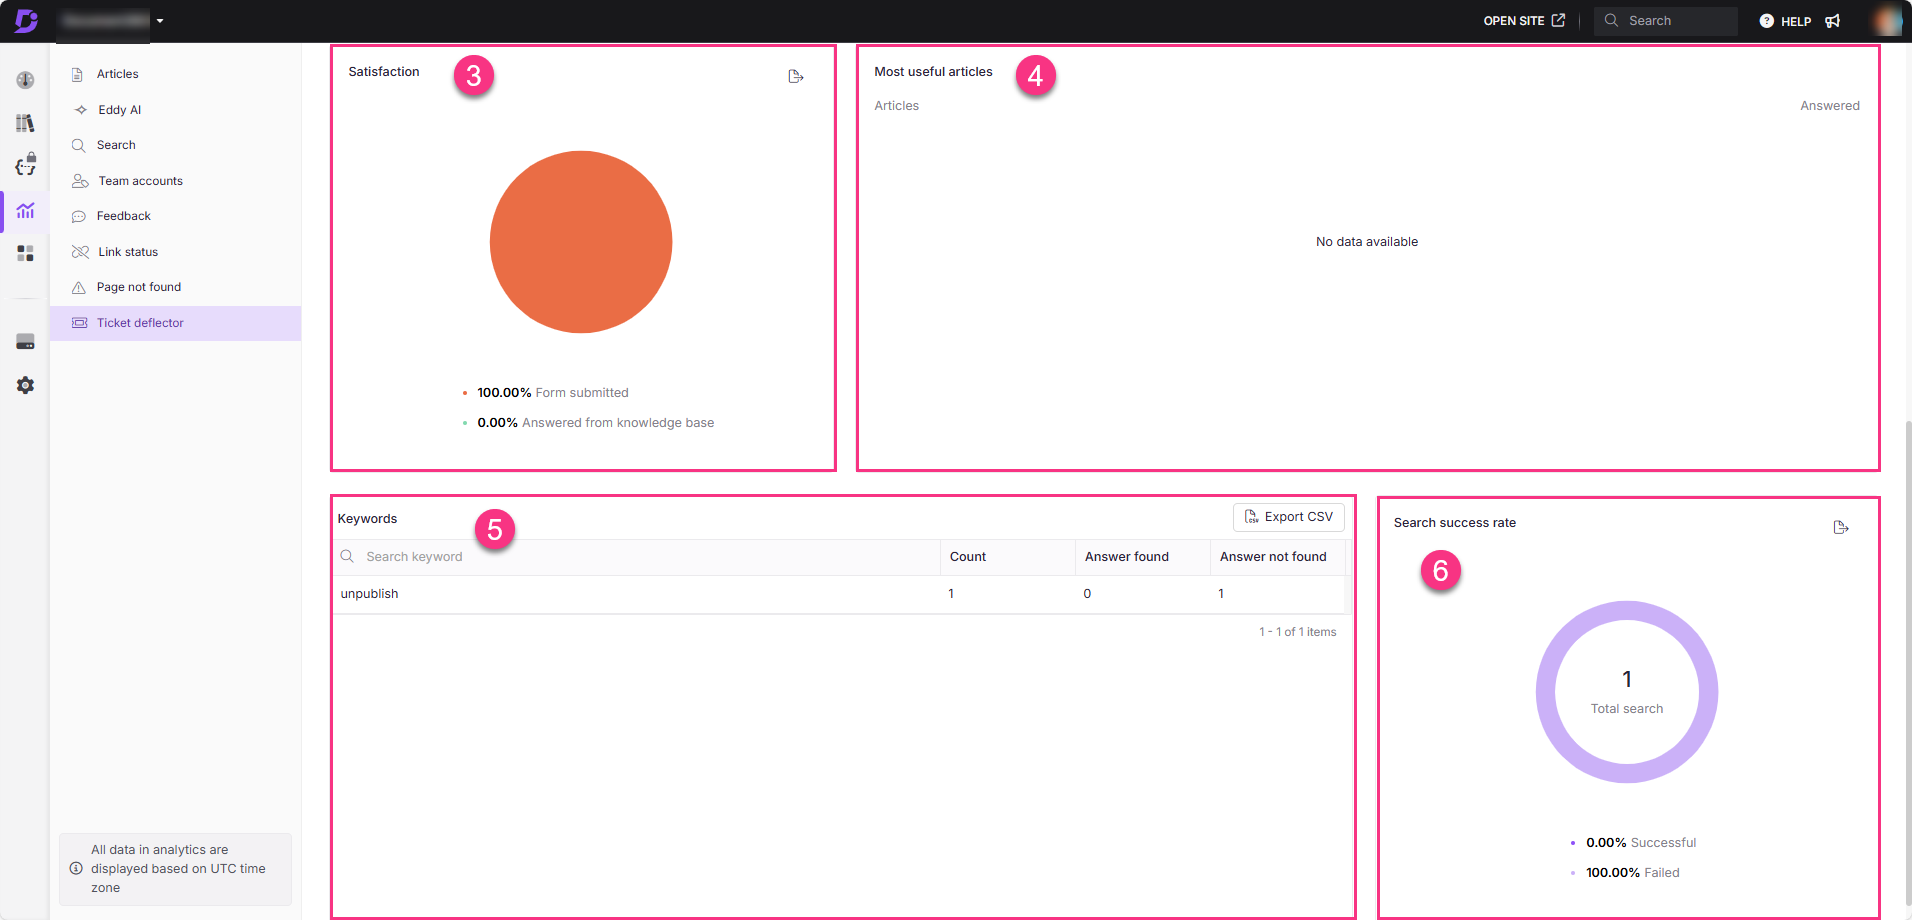
Keywords
This section shows keyword-level search data from the ticket deflector form:
| Field | Description |
|---|---|
| Keyword | The search term entered by the user. |
| Count | Number of times the keyword was searched. |
| Answer found | Whether the search returned a relevant result. |
| Answer not found | Whether the search failed to return a result. |
Click Export CSV to download the keywords list in .csv format.
Search success rate
This pie chart shows the percentage of searches that returned results (successful) versus those that did not (unsuccessful) for the selected ticket deflector form. Click Export image () to save it as a PNG file.
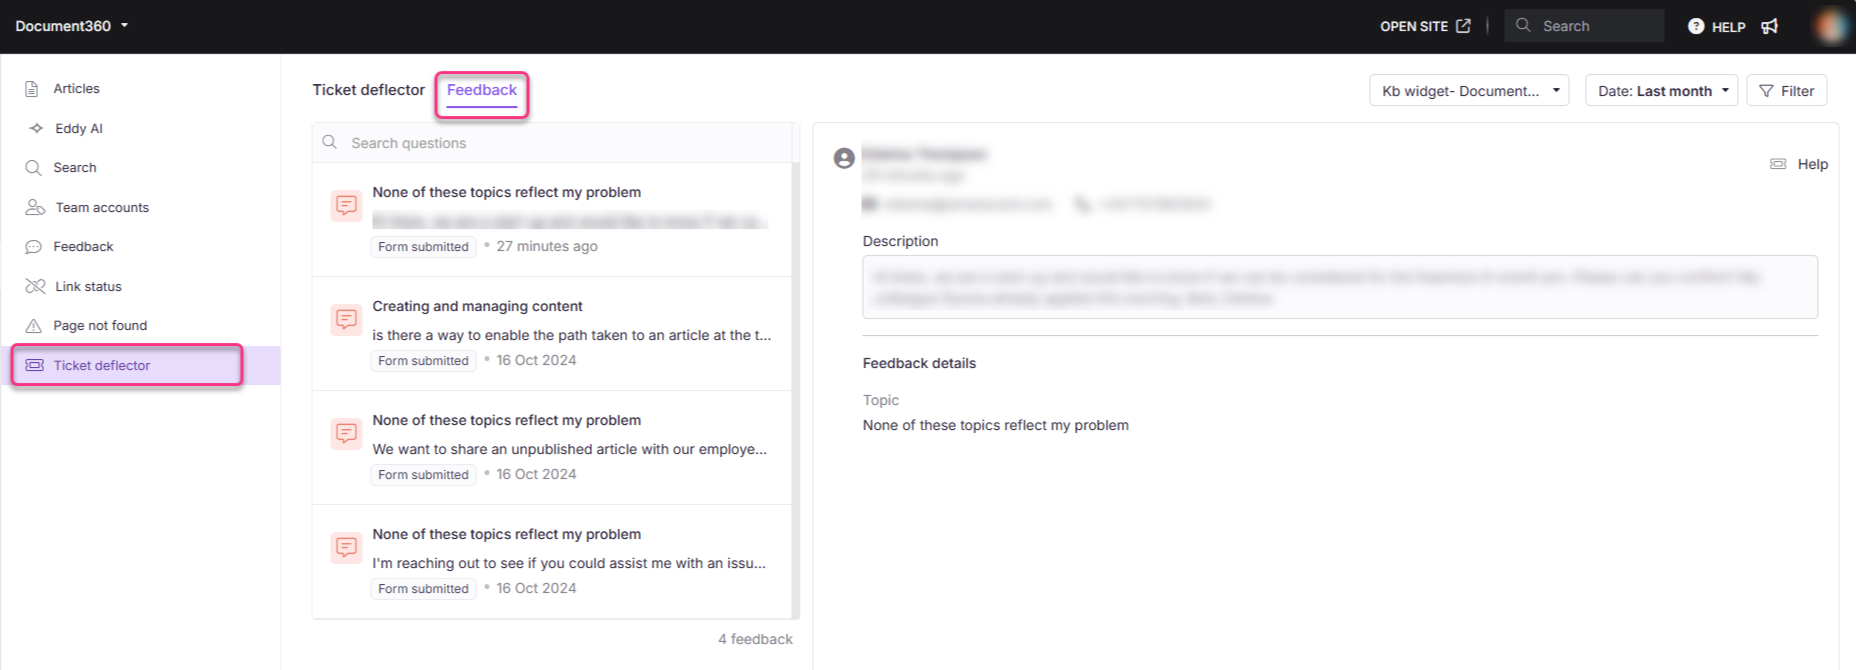
Feedback tab
The Feedback tab lists all user feedback submitted through ticket deflector forms. Each entry is labelled to indicate its source (Form submitted or Answered from knowledge base) and shows the date and time it was received. Click an entry to view the full feedback content.
Best practices
- Monitor the Answered from knowledge base metric regularly. A rising count means your knowledge base is effectively deflecting tickets. A stagnant or declining count signals that content needs updating.
- Review the Keywords section for Answer not found entries. These are direct content gaps. Create or improve articles to cover those search terms.
- Use Frequently selected questions to align your content. If the same questions keep appearing, make sure those topics are well covered and easy to find in your knowledge base.
- Check Most useful articles after publishing new content. If a new article does not appear here despite covering a relevant topic, review its title and keywords for searchability.
- Filter by Widget versus Knowledge base to compare deflection rates. If widget deflection is significantly lower, your widget content or configuration may need attention.
FAQ
What is a ticket deflector?
A ticket deflector is a feature that reduces support tickets by surfacing relevant knowledge base articles while a user is filling out a ticket form. If the suggested articles answer their question, the user can exit the form without submitting a ticket. To set one up, see Creating a ticket deflector form.
How does the ticket deflector work?
As a user types into the ticket form, the system searches the knowledge base using keywords from their query and displays suggested articles. If a suggested article resolves the issue, the user can close the form without submitting a ticket.
What does the Answered from knowledge base metric represent?
It shows the number of queries resolved by suggested knowledge base articles, without the user needing to submit a ticket. A higher count indicates your knowledge base is effectively deflecting support requests.
How is the search success rate calculated?
The search success rate compares the total number of searches performed in the ticket deflector form with the number that returned at least one relevant article. Searches that return results are classified as successful; those that return nothing are classified as unsuccessful.