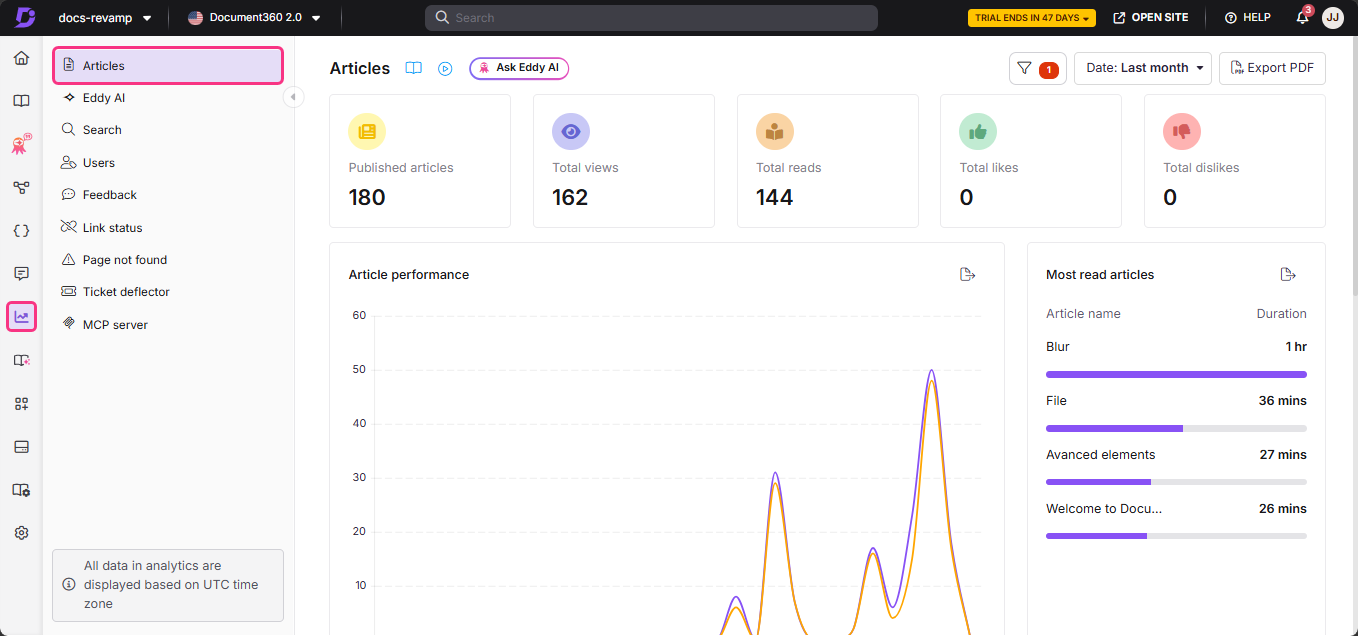
Articles analytics in Document360 gives you a centralised view of how readers discover, consume, and respond to your knowledge base content. Use this page to track article views, reads, engagement trends, top-performing content, categories, and reader locations — all in one place.
Before you begin
You must have Analytics access enabled in your content role. If you cannot access this page, contact your project administrator.
How to access articles analytics
- In the left navigation bar of your Knowledge base portal, navigate to Analytics ().
- In the left navigation pane, click Articles.
The Articles analytics page opens with an overview of article data specific to the current workspace and language.
How to use filters to customise data
By default, the analytics page shows metrics for the last week. You can adjust the scope using the available filters.
Date filter
- Click the Date filter dropdown.
- Select a predefined range such as This month or Last month, or select Custom to specify a date range.
The Custom date range available depends on your plan:
- Business — Select any custom date range of up to 3 months. The selected period is not restricted to the most recent 3 months.
- Enterprise — Select any custom date range of up to 1 year. The selected period is not restricted to the most recent 12 months.
User type filter
- Click the All users dropdown to filter analytics data by user type.
The available options depend on your project type:
| Project type | Available filter options |
|---|---|
| Mixed projects | All, Users, Public readers, Private readers |
| Private projects | All, Users, Readers |
| Public projects | This filter is not available |
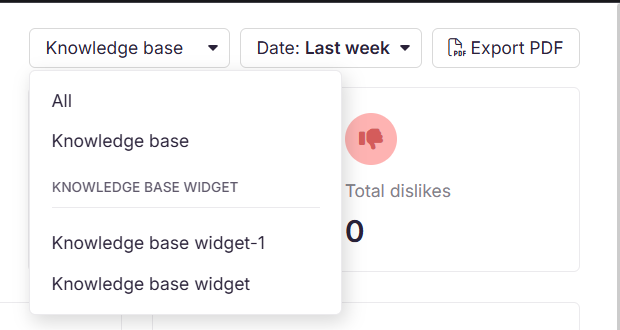
Knowledge base widget filter
- If you use the Knowledge base widget, use the top-right dropdown to switch between All, Knowledge base, and Widget analytics.
- Select the JWT widget option to track user interactions and engagement within private and mixed projects secured by JWT authentication.
For more information, see Managing the Knowledge base widget.
- Article analytics data can take up to 15 minutes to reflect in the portal.
- When the Anonymize reader information setting is enabled, reader-identifiable information is anonymised across all analytics modules. User-based drilldowns and exports will not display reader names, email addresses, or reader IDs.
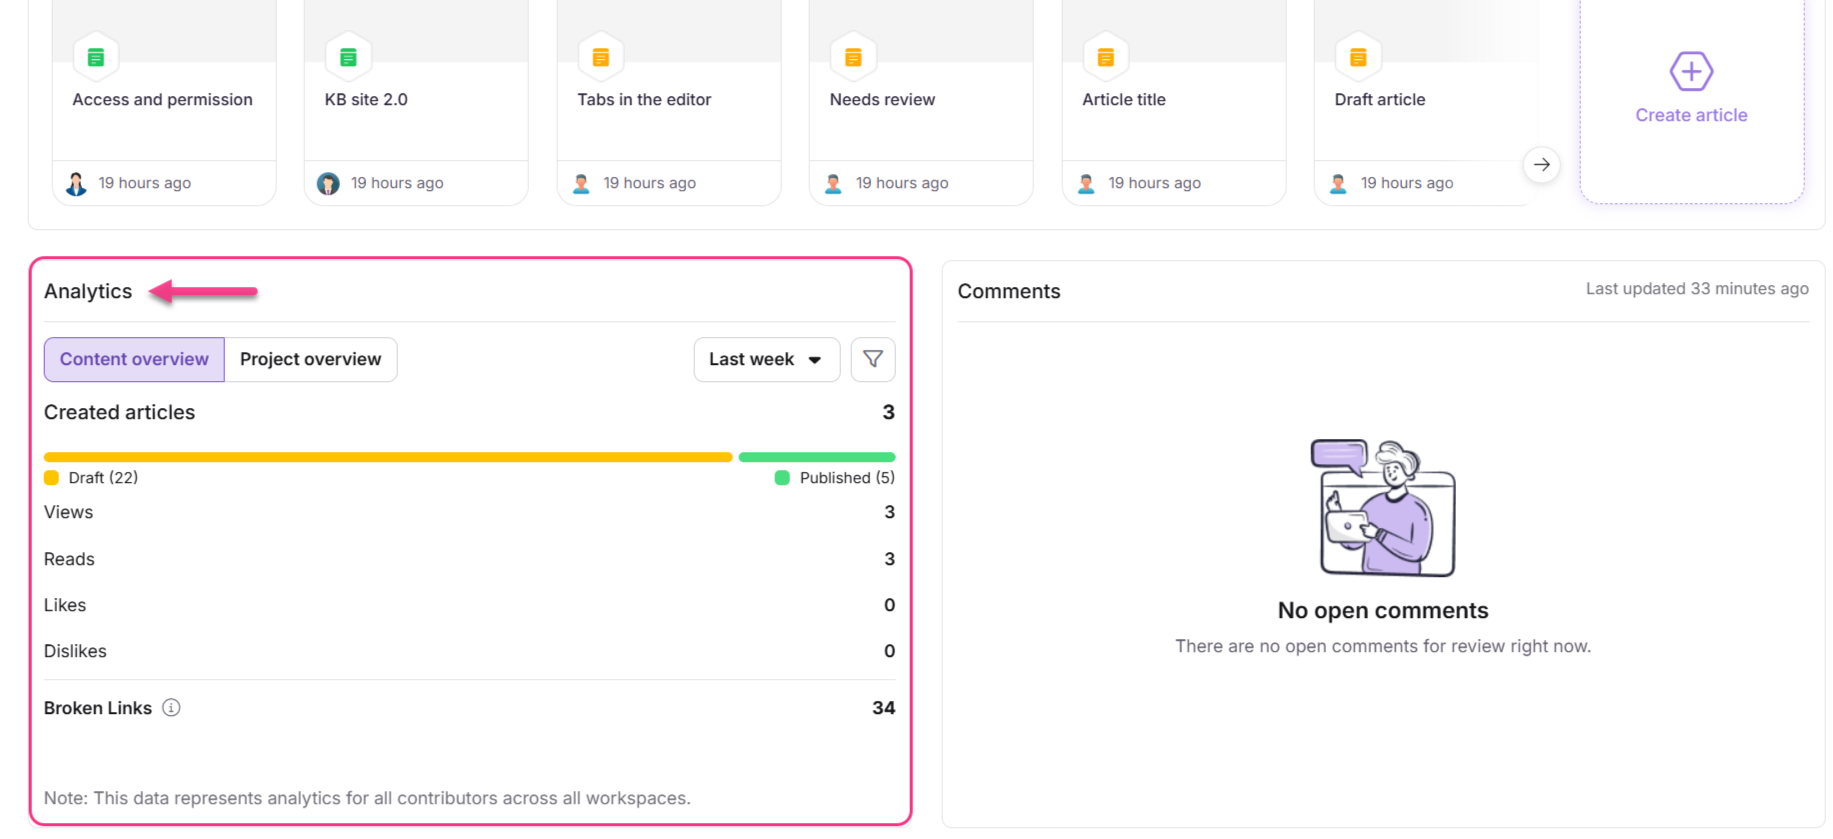
Viewing article analytics on the Overview page
If you are a contributor, the Analytics card on the Overview page shows metrics for the articles you have contributed to, including:
- Created articles (Draft and Published)
- Views
- Reads
- Likes
- Dislikes
If you are an admin, the Analytics card includes two tabs:
| Tab | What it shows |
|---|---|
| Content overview | Combined analytics for all contributors in the project |
| Project overview | High-level project metrics not affected by contributor or date filters |
To view analytics for only your own contributions, select yourself from the contributor filter.
For more information, see the Analytics card article.
To learn what each section on the Articles analytics page measures, see Articles analytics — metrics and sections.